
8-OHdG/Creatinine Ratio Too High? Urine ELISA Troubleshooting
Quick answer
A researcher running an 8-OHdG ELISA and a creatinine ELISA on human urine got 8-OHdG/creatinine ratios in the hundreds, then the thousands, of ng/mg, far above the ~30–40 ng/mg reported in the literature. Two errors in the calculations came first: a curve-fit equation that was never solved for concentration, and a poorly fitting model. Once those were fixed, the calculations were sound. The ratios still looked high because neither analyte had been diluted into the middle of its own standard curve and checked for dilution linearity in urine. In a ratio, both of those errors push the result in the same direction.
On this page
The problem
A researcher was measuring oxidative DNA damage in urine from a human clinical cohort. They normalized 8-hydroxy-2′-deoxyguanosine (8-OHdG) to urinary creatinine, which is standard practice. Both analytes were measured by competitive ELISA. Urine for creatinine was clarified and run undiluted. Urine for 8-OHdG was clarified and diluted 1:40.
Both standard curves looked good. Even so, the calculated 8-OHdG/creatinine ratios averaged around 500 ng/mg, and after a first round of corrections they climbed into the thousands.
Snapshot of the data
Fixing the curve fit lowered the creatinine values. Because creatinine is the denominator, that made the ratio worse.
| Stage | 8-OHdG (ng/mL urine) | Creatinine (mg/mL urine) | Ratio (ng/mg) |
| First pass (equation not inverted) | ~90 | ~0.18 | ~500 |
| After correct curve fit | ~160 | ~0.01–0.04 | Thousands |
| Typical literature range | ~5–40 | ~0.3–3 | ~30–40 |
Now compare where each analyte should sit in the well with each kit's standard range:
| Analyte | Kit range | Dilution used | Expected in-well level |
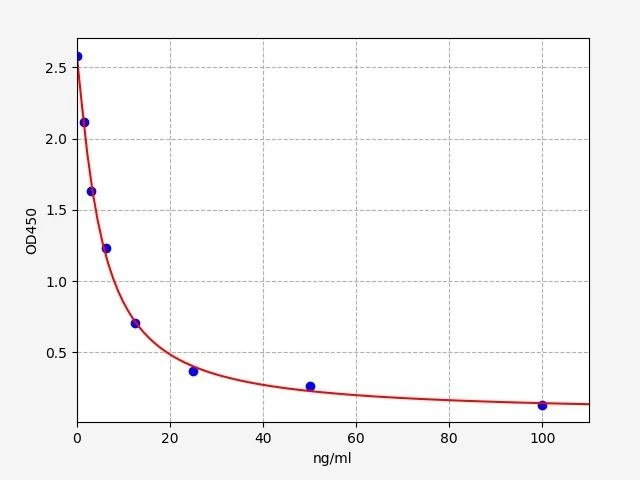
| 8-OHdG | 1.563–100 ng/mL | 1:40 | ~0.1–1 ng/mL, below the lowest standard |
| Creatinine | 1.25–80 µg/mL | Neat | ~300–3,000 µg/mL, far above the top standard |
Values are illustrative and rounded to show the trend, not exact readings from any single run. Literature ranges are approximate and vary by method and population.
Why it happens
A ratio multiplies errors from two assays. If 8-OHdG reads slightly high and creatinine reads low, the ratio can end up an order of magnitude off, even though neither value looks extreme by itself.
Urinary creatinine is usually present in the mg/mL range, while this creatinine ELISA reads up to 80 µg/mL. Undiluted urine should therefore sit at or beyond the top of the curve. If neat urine reads mid-curve, the sample isn't behaving like the standards, and only a dilution series can show which value is true. At a 1:40 dilution, typical urinary 8-OHdG falls below the lowest standard. Readings in that region carry the most error, and in a competitive assay that error often shows up as falsely high values.
Method also matters. Antibody-based 8-OHdG assays often report higher absolute values than LC-MS/MS, so compare ratios with published values from the same method.
Our analysis
We started with the calculations. The spreadsheet had a trendline equation that was never rearranged to solve for concentration. It also used a model that fit the creatinine curve poorly: a neat sample at OD 0.295 back-calculated to ~178 µg/mL, when the curve itself pointed to roughly 10–40 µg/mL. When we re-fit the data with a four-parameter logistic (4PL) model and let the software back-calculate, the creatinine values became consistent with the curve.
The 8-OHdG standard curve and calculations then checked out. Our lab shared its validation data: human serum at 1:2 and 1:5 dilutions read 18–190 ng/mL. That means the kit can report fairly high absolute values, and the cohort's disease state may also have raised oxidative-stress markers. The researcher and their PI agreed the assays had worked and the calculations were sound. The mismatch with the literature was a question of sample preparation and interpretation, not a kit failure.
Root cause
The first inflated ratios came from data-analysis errors: an equation that was never inverted and a poorly fitting model. The high ratios that remained afterwards are best explained by a dilution scheme that didn't match either assay's range. Creatinine was run neat and 8-OHdG was over-diluted, and neither was confirmed by dilution linearity in urine. On top of that, the ratios were compared against literature values from different methods and populations.
What we recommended
Key takeaway
A normalized ratio is only as good as its weakest assay. Give each analyte its own dilution so it lands mid-curve, confirm it with dilution linearity in your matrix, and fit both curves with 4PL. Then the 8-OHdG/creatinine ratio reflects biology rather than arithmetic. For more help with curves and sample prep, visit our ELISA Support Hub →
FAQ
Why did fixing my curve fit make the ratio worse?
The correct fit lowered creatinine. Creatinine is the denominator, so a smaller value gives a larger ratio. That told us the remaining issue was in sample preparation, not in the arithmetic.
Can I run urine undiluted in the creatinine ELISA?
Usually not. Urinary creatinine is typically in the mg/mL range, far above the kit's 80 µg/mL top standard. Run a dilution pilot and pick a dilution that lands mid-curve.
Which curve model should I use for a competitive ELISA?
A 4PL fit (or 5PL for asymmetric curves) describes the sigmoidal shape much better than linear or polynomial trendlines. Use software that back-calculates concentration directly.
My values are higher than published ones. Is the kit wrong?
Not necessarily. Absolute 8-OHdG values vary by method (ELISA vs LC-MS/MS), population and disease state. If your curves, dilution linearity and controls pass, differences between groups within your study are the most reliable result.
Related reading
Calculating & Analyzing ELISA Data (4PL, standard curves) →
The ELISA Controls Guide (matrix effects & spike controls) →
101 ELISA Troubleshooting Tips →
Complete ELISA Guide: Principles, Methods & Kits (competitive ELISA) →
8-OHdG / 8-Hydroxydeoxyguanosine ELISA Kit →
SKU: UNFI0029 • Competitive ELISA • Universal species
| Detection range | 1.563–100 ng/mL |
| Sensitivity | 0.938 ng/mL |
| Sample types | Serum, plasma, urine, cell culture supernatant, cell/tissue lysate, other liquid samples |
€649
View product →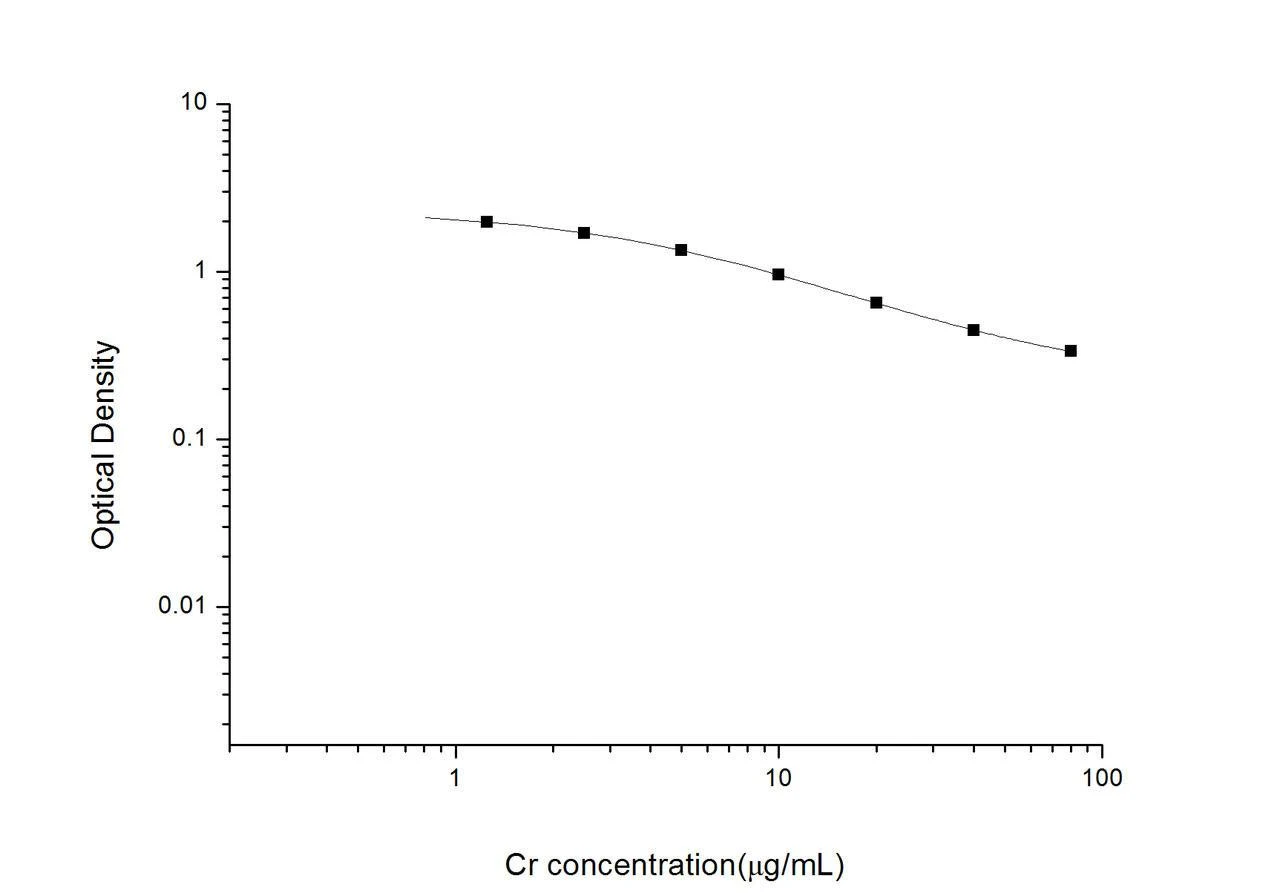
Cr (Creatinine) ELISA Kit – High Sensitivity →
SKU: UNES00038 • Competitive ELISA • Universal species
| Detection range | 1.25–80 µg/mL |
| Sensitivity | 0.75 µg/mL |
| Sample types | Serum, plasma & other biological fluids |
€659
View product →Ratios that don't match the literature?
Our PhD-level support team can review your curve fits, dilutions and normalization and help you get data you can trust.
This article summarizes an anonymized customer support case for educational purposes. Data values are illustrative. Expected analyte concentrations, optimal dilutions and reference ranges vary by sample type, method and study population. Always validate conditions for your own samples and refer to the current product datasheet.
Recent Posts
-
8-OHdG/Creatinine Ratio Too High? Urine ELISA Troubleshooting
Quick answer A researcher running an 8-OHdG ELISA and a creatinine ELISA on human ur …23rd Sep 2026 -
Do Not Eat Me Is Not a Switch
Phagocytosis is a subtraction, not a switch. A macrophage engulfs when its activating signals excee …23rd Sep 2026 -
One Cytokine, Two Opposite Clinical Effects
Low-dose IL-2 expands regulatory T cells. High-dose IL-2 expands the cells they exist to restrain. …23rd Sep 2026