
Glucose Assay Saliva Troubleshooting: Fixing Low Readings
Quick answer
A researcher measuring glucose in human saliva on the fluorometric procedure of a glucose assay kit had a textbook standard curve, yet every sample read far below the expected physiological range — unfiltered samples worst of all. The kit was not faulty: undiluted saliva is a complex matrix that suppresses the reaction (matrix interference), and the neat signal also sat at the bottom of the narrow fluorometric range. A dilution-linearity series (1:5 → 1:25) lifted the values until they plateaued at 1:20–1:25, landing in the expected 0.7–2 mg/dL band. The fix: dilute complex matrices into the middle of the curve and confirm the result is dilution-independent.
On this page
The problem
A researcher was quantifying glucose in human saliva from healthy fasting volunteers using the fluorometric procedure of a colorimetric/fluorometric glucose assay kit. Samples were centrifuged and run both filtered and unfiltered, with no dilution applied. The standard curve looked excellent, but every reading came back implausibly low versus the 0.7–2 mg/dL expected for healthy saliva — and the unfiltered samples read lowest of all.
The experiment had been repeated three times across four separate kits with consistent results, so simple user error or a single bad kit could be ruled out. A clean curve but suppressed, matrix-dependent sample values pointed somewhere more specific.
Snapshot of the data
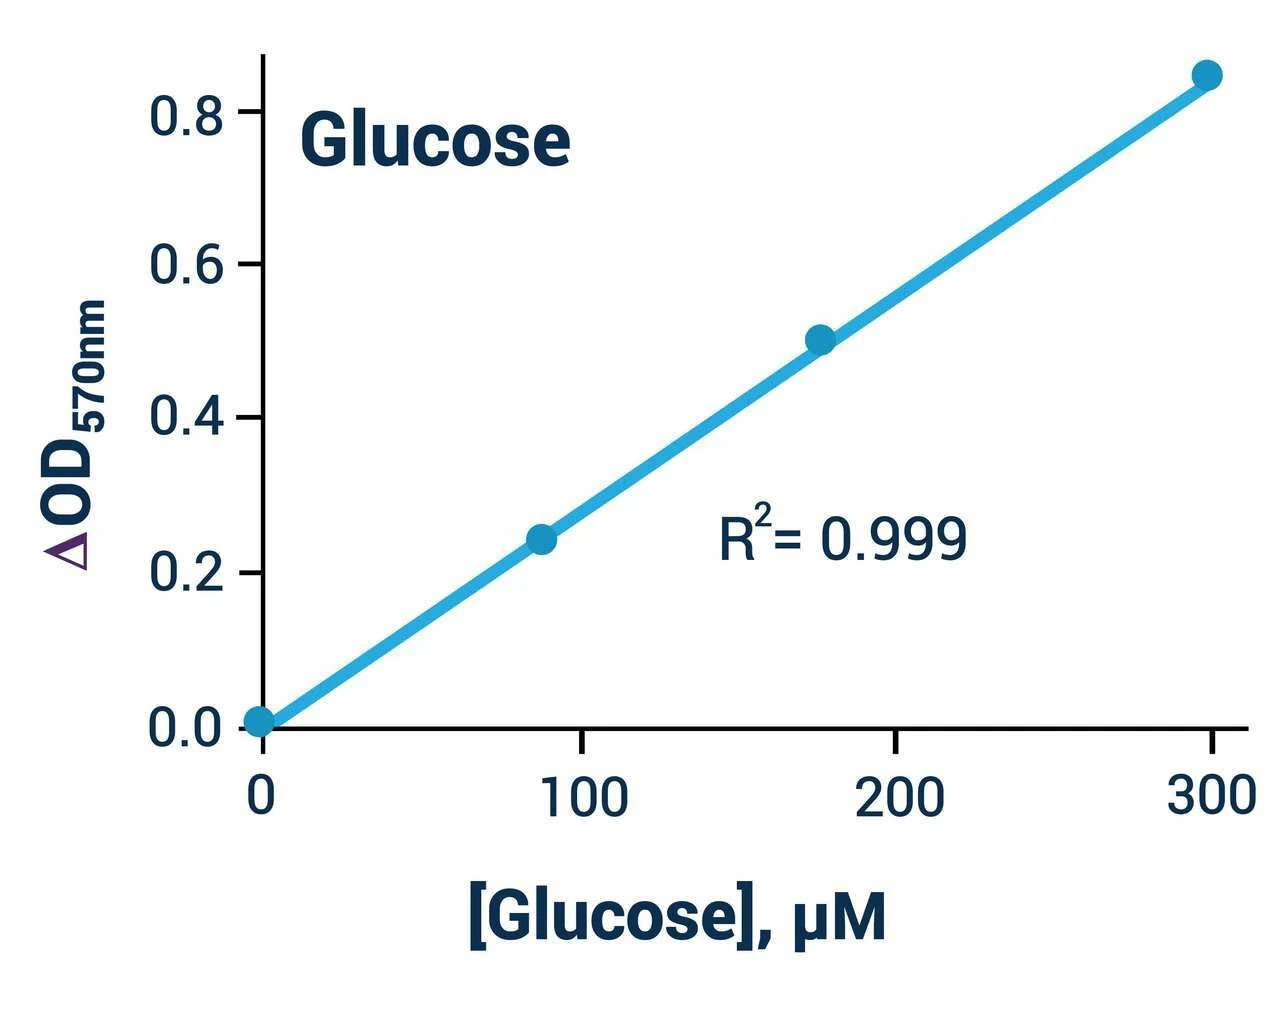
The standard curve was well-behaved across the fluorometric working range. The problem appeared only when neat saliva was quantified against it — and, tellingly, the back-calculated glucose rose as the samples were diluted, instead of staying constant.
| Sample treatment | Back-calculated glucose (mg/dL) | Reads against curve |
| Neat, unfiltered | ~0.08 | Far below expected |
| 1:5 | ~0.19 | Still low |
| 1:10 | ~0.34 | Rising |
| 1:15 | ~0.53 | Rising |
| 1:20 | ~0.71 | In expected range — plateau begins |
| 1:25 | ~0.73 | Matches 1:20 — linearity reached |
Values are illustrative and rounded to show the trend, not exact readings from any single run.
Reference point: fasting salivary glucose in healthy, non-diabetic individuals is typically reported at roughly 0.7–1.0 mg/dL, and generally below ~2 mg/dL — so the 1:20–1:25 results are physiologically sensible, while the neat reading is not.
Why it happens
Two effects overlapped. First, the fluorometric procedure has a narrow, low working range — roughly 1–30 µM glucose (~0.018–0.54 mg/dL). That is below the concentration the team expected, so neat signal risks sitting at the extreme low end of the curve where it is easy to misread.
Second, and more importantly, undiluted saliva is a complex biological matrix. Neat saliva carries proteins, mucins, salts and other dissolved substances that can inhibit the enzyme/dye chemistry, pulling the signal down into falsely low values. Centrifuging and filtering remove particulates but not these dissolved interferents — which is why the unfiltered samples, carrying the full matrix load, read lowest. Diluting the sample dilutes the interferents and the analyte together, releasing the suppression and moving signal into the reliable middle of the curve.
Our analysis
The diagnostic clue was that the back-calculated concentration climbed with each additional dilution instead of holding steady. A true concentration is fixed: once you correct for the dilution factor, it should read the same at 1:5 or 1:25. When apparent concentration instead increases with dilution, the lower dilutions are being suppressed — the fingerprint of matrix interference.
Across the series the apparent glucose rose from ~0.08 mg/dL (neat) through the intermediate dilutions and then plateaued at 1:20 and 1:25 (~0.71–0.73 mg/dL). That plateau — where the result stops changing with further dilution — is where the matrix effect has been diluted out and the reading becomes trustworthy. It also lands in the expected physiological range, giving independent confidence in the value.
Root cause
Matrix interference from undiluted saliva was suppressing the fluorometric signal and producing falsely low glucose values — compounded by neat sample signal sitting at the very bottom of the assay's narrow fluorometric range. The kit was performing correctly; the samples simply needed to be diluted into the assay's optimal working window before they could be read accurately.
What we recommended
Key takeaway
A flawless standard curve does not guarantee accurate sample values. In a complex matrix, spuriously low readings are the classic fingerprint of matrix interference — and a dilution-linearity series is the quickest way to find the window where results become concentration-independent and physiologically believable. For more standard-curve and matrix-troubleshooting guidance, see our ELISA Support Hub →
FAQ
Why did diluting my samples make the glucose value go up?
In neat matrix, interfering substances suppress the reaction, so the reading is falsely low. Dilution relieves that suppression. When the back-calculated value stops rising and levels off across further dilutions, you have reached the true concentration.
Filtered vs unfiltered — why were the unfiltered samples worse?
Filtration and centrifugation remove particulates but not the dissolved substances that cause interference. Unfiltered samples carry the full matrix load, so signal suppression is stronger and the readings come out lower.
Should I use the colorimetric or fluorometric procedure for saliva?
It depends on your expected concentration. The fluorometric method is more sensitive but has a narrow, low range (~1–30 µM). If samples sit above that, either apply a suitable dilution on the fluorometric procedure or switch to the wider colorimetric range.
How do I know which dilution to trust?
Trust the dilution at which the back-calculated concentration plateaus across increasing dilution factors — that parallelism (linearity of dilution) shows the matrix effect has been diluted out. Then pick the lowest dilution that still sits on that plateau to save sample.
Related reading
Calculating & Analyzing ELISA Data (standard curve, %CV, spike recovery) →
The ELISA Controls Guide (matrix effects & controls) →
SKU: BA0081 • Colorimetric / Fluorometric • 100 tests
| Detection range | Colorimetric ~5–300 µM; fluorometric ~1–30 µM |
| Sample volume | As little as 20 µL per reaction |
| Sample types | Serum, plasma, milk, culture medium & other biological samples |
€1,033
View product →Still seeing readings that don't add up?
Our PhD-level scientific support team can review your standard curve, dilutions and matrix and help you get publication-ready data.
This article summarizes an anonymized customer support case for educational purposes. Data values are illustrative. Expected analyte concentrations, optimal dilutions and detection ranges vary by sample type and study; always validate conditions for your own samples and refer to the current product datasheet.
Recent Posts
-
Glucose Assay Saliva Troubleshooting: Fixing Low Readings
Quick answer A researcher measuring glucose in human saliva on the fluorometric proc …22nd Sep 2026 -
The Research Pulse 2026: Where Biology Is Heading, According to PubMed and 300,000 Researcher Visits
Research Pulse · Data study Where biology is heading: what PubMed and 300,000 researcher visits re …22nd Sep 2026 -

Cómo eliminar endotoxinas de proteínas recombinantes sin perder actividad biológica
Cómo eliminar endotoxinas de proteínas recombinantes sin perder actividad biológica La forma más fi …22nd Sep 2026