
ELISA Troubleshooting: Total Protein Normalization in Lysates
QUICK ANSWER
A researcher ran a panel of EMT-marker ELISA kits (E-cadherin, claudin-1, N-cadherin, vimentin, ZEB1, TWIST1) on breast cell-line lysates and found E-cadherin reading "positive" in a mesenchymal line where it is barely expected — an apparent false positive. The kits were fine. The mismatch came from comparing raw lysate concentrations across cell lines without normalizing to total protein, plus a detergent-heavy lysis buffer the assays are not validated for. Normalize each result to total protein (analyte per mg protein), use a compatible buffer, and the expected epithelial-vs-mesenchymal pattern returns.
On this page
The problem
A researcher was profiling epithelial-mesenchymal transition (EMT) across a panel of breast cell lines using a sampler pack of single-analyte ELISA kits — one 96-well plate each for E-cadherin, claudin-1, N-cadherin, vimentin, ZEB1 and TWIST1. Two of the lines are textbook benchmarks: an epithelial line expected to express E-cadherin and claudin-1 strongly, and a mesenchymal line expected to show the opposite, with high vimentin, N-cadherin, ZEB1 and TWIST1.
The kit protocol was followed without any obvious issue, but the results didn't line up with the literature. Most strikingly, the E-cadherin plate reported measurable signal in the mesenchymal line, where E-cadherin is normally low or absent — enough to read as a false positive and cast doubt on the whole panel.
Snapshot of the data
Reading the raw interpolated E-cadherin concentrations straight off each plate, the mesenchymal line looks unexpectedly positive. Notice that it was also the more protein-rich lysate:
| Cell line (benchmark) | Total protein in lysate | E-cadherin (raw, ng/mL) | Apparent call |
| Epithelial benchmark | 2.0 mg/mL | 6.8 | High (expected) |
| Mesenchymal benchmark | 3.9 mg/mL | 4.5 | "Positive" (unexpected) |
Once each result is divided by the total protein in its own lysate, the picture flips and matches the biology — the mesenchymal line is comparatively low:
| Cell line (benchmark) | E-cadherin (ng/mL) | Total protein | Normalized (ng/mg) | Corrected call |
| Epithelial benchmark | 6.8 | 2.0 mg/mL | 3.4 | High (expected) |
| Mesenchymal benchmark | 4.5 | 3.9 mg/mL | 1.15 | Low (expected) |
Values are illustrative and are used to show the effect, not the researcher's actual readings.
Why it happens
A lysate ELISA tells you how much target is in the tube you loaded — not how many cells you started with. Two lysates from different cell lines almost never contain the same total protein, so a raw ng/mL value conflates target expression with how much total material ended up in the well. A denser, protein-rich lysate can out-read a genuinely E-cadherin-high sample simply because there is more of everything in it.
The lysis buffer matters too. These kits are validated on lysates prepared without strong detergents: the protocol calls for RIPA without NP-40, Triton X-100 or high DTT (or a mild Tris/NaCl/SDS buffer with protease inhibitors). Excess detergent or reducing agent can disrupt the conformational epitopes a sandwich pair relies on and raise background — both of which distort cross-sample comparisons.
Our analysis
Each kit interpolated cleanly off its own standard curve, and the lot-to-lot controls were within range — so the plates themselves were performing to spec. That pointed away from a faulty kit and toward how the samples were prepared and compared.
Two checks confirmed it. Re-expressed per milligram of total protein, the "positive" mesenchymal signal dropped well below the epithelial benchmark, restoring the expected pattern. And a spike-recovery test on the mesenchymal lysate came back low — the classic fingerprint of matrix interference from the detergent-rich buffer. Together they explain an apparent false positive with no fault in the assay.
Root cause
The apparent false positive was not a kit fault. It traced to two sample-side issues: raw lysate concentrations were compared across cell lines without normalizing to total protein, and the lysates were prepared in a detergent-heavy buffer the assays are not validated for, which introduced matrix interference. Normalize to total protein and use a compatible buffer, and the epithelial-vs-mesenchymal pattern resolves.
What we recommended
Normalize every result to total protein. Run a BCA or Bradford assay on each lysate and express the target as ng (or pg) analyte per mg total protein. Only compare cell lines after this step.
Use a compatible lysis buffer. Follow the datasheet: RIPA without NP-40, Triton X-100 or high DTT, or a mild 50 mM Tris / 0.9% NaCl / 0.1% SDS buffer with protease inhibitors — and keep the same buffer across all plates so samples are comparable.
Confirm samples sit inside the standard curve. Dilute concentrated lysates so readings fall within the kit's quantitative range rather than at the top plateau, where differences compress.
Run a spike-recovery and dilution-linearity check. Spike a known amount of standard into one lysate; recovery near 80–120% means the matrix is behaving. Poor recovery signals interference — dilute further to move out of it.
Compare interpolated concentrations, never raw OD across plates. Each target is a separate kit with its own standard curve; read every plate against its own standards and keep replicate %CV under 20%.
Confirm the two benchmark lines orthogonally. A quick Western blot or qPCR on the epithelial and mesenchymal controls anchors the ELISA panel and flags any single plate that drifts.
Key takeaway
When lysate ELISA results contradict known cell-line biology, suspect the samples before the kit. Normalizing to total protein and using a validated lysis buffer are what make cross-line comparisons meaningful — and a spike-recovery check will usually tell you within one plate whether the matrix is the culprit. For more worked examples, see our ELISA Support Hub →
Frequently asked questions
Why do I need to normalize lysate ELISA data to total protein?
Because a raw concentration reflects both target expression and how much total material is in the lysate. Different cell lines yield different total protein, so only per-mg-protein values let you compare expression between them fairly.
Could the false positive mean the kit cross-reacts?
It's rarely the first suspect. When standards interpolate correctly and controls are in range, an unexpected signal in a lysate is far more often matrix interference or a normalization artifact than genuine cross-reactivity. A spike-recovery test distinguishes the two.
Which lysis buffer should I use with these ELISA kits?
A RIPA buffer without NP-40, Triton X-100 or high DTT, or a mild 50 mM Tris / 0.9% NaCl / 0.1% SDS buffer with protease inhibitors. Strong detergents and reducing agents can disrupt epitopes and raise background. Use the same buffer for every sample in the comparison.
Can I compare optical density between two different kits?
No. Each kit has its own standard curve and dynamic range, so only interpolated concentrations are comparable — and even then, only after normalizing to total protein. Read every plate against its own standards.
Related reading
Calculating & Analyzing ELISA Data — standard curves, %CV and spike recovery →
ELISA Controls Guide — blanks, NSB and spiked-matrix controls →
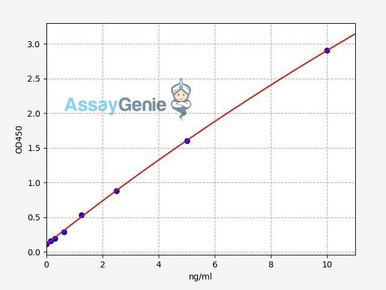
Human E-Cadherin ELISA Kit (HUFI00102) →
SKU: HUFI00102 · Sandwich ELISA, double antibody
| Detection range | 0.156–10 ng/mL |
| Sensitivity | 0.094 ng/mL |
| Sample types | Serum, plasma, cell culture supernatant, cell or tissue lysate |
€599
View product →Results not matching the biology?
Our PhD-level support team will review your data and standard curves with you.
This article is based on an anonymized technical-support case and is provided for research guidance only. All data values shown are illustrative. Assay Genie products are for research use only and are not intended for diagnostic procedures.
Recent Posts
-
Suspected Plague Death at a Siberian Anti-Plague Institute: What Researchers Should Know
Infectious Disease · News AnalysisSuspected Plague Death at a Siberian Anti-Plague Institute: What …6th Oct 2026 -
LPS ELISA Troubleshooting: The Importance of Sample Nature
Quick answer A researcher measuring circulating lipopolysaccharide (LPS) in human serum …25th Sep 2026 -

Sekundärantikörper wählen: Die Regel, die im Labor wirklich zählt
Sekundärantikörper wählen: Die Regel, die im Labor wirklich zählt Wählen Sie einen Sekundärantikörp …24th Sep 2026