
Red Blood Cell Peroxidase Interference in Competitive ELISA
QUICK ANSWER
A researcher ran a competitive 2,3-bisphosphoglycerate (2,3-BPG) ELISA on red blood cell (RBC) lysate. The standard curve was textbook, yet every lysate sample read at the top of the curve with no dose-response, and the most concentrated sample gave a negative absorbance. The kit was working — the sample matrix was not. RBC lysate carries endogenous peroxidase activity that reacts with the kit’s TMB substrate independently of the HRP conjugate, generating non-specific colour and unreliable readings. RBC lysate is not a validated matrix for this kit, so it needs validation before the numbers can be trusted.
On this page
The problem
A researcher was developing an assay to quantify 2,3-BPG in red blood cell lysate. They prepared a 3-fold dilution series of RBC suspensions (roughly 1×10⁶ to 8×10⁷ cells/mL), lysed the cells by four freeze–thaw cycles in liquid nitrogen, cleared the debris by centrifugation, and assayed the supernatant with a competitive 2,3-BPG ELISA.
The standard curve came out clean. But the samples told a confusing story: every dilution returned almost the same high absorbance regardless of cell number — no dose-dependence at all — and the most concentrated suspension returned a negative reading. Pushing cell density even higher (up to 5×10⁸ cells/mL) changed almost nothing.
Snapshot of the data
The standard curve behaved exactly as a competitive assay should — absorbance falls as analyte concentration rises, spread over a wide, monotonic range:
| Standard | OD₃₅₀ (illustrative) |
| Standard 1 (highest) | 0.18 |
| Standard 2 | 0.27 |
| Standard 3 | 0.40 |
| Standard 4 | 0.61 |
| Standard 5 | 0.95 |
| Standard 6 | 1.35 |
| Standard 7 | 1.88 |
| Zero / blank | 3.05 |
The RBC lysate samples, however, ignored the curve. They clustered at the top (the zero-standard level) with no gradient, and the densest suspension crashed to a negative value:
| RBC suspension | OD₃₅₀ | What we saw |
| 1.0×10⁶ cells/mL | 2.98 | Flat — top of curve |
| 3.0×10⁶ cells/mL | 2.97 | Flat — no dose-response |
| 9.0×10⁶ cells/mL | 2.98 | Flat — no dose-response |
| 2.7×10⁷ cells/mL | 3.00 | Flat — top of curve |
| 8.1×10⁷ cells/mL | −0.002 | Anomalous negative |
Values are illustrative and rounded to show the pattern, not the customer’s exact readings.
Why it happens
This is a competitive ELISA, so signal is inversely proportional to analyte: a high absorbance nominally means “little or no analyte detected.” Taken at face value, the samples looked like they contained almost no 2,3-BPG. But four different dilutions returning the same top-of-curve value — and the densest sample crashing to a negative OD — is not a real concentration readout. It is the fingerprint of matrix interference, not a measurement.
RBC lysate is a demanding matrix. Red cells are packed with haemoglobin and enzymes, and freeze–thaw lysis releases peroxidase-like activity straight into the supernatant — which matters because of how the kit generates its signal.
Our analysis
Our lab team reviewed the run. Because the standard curve sat within spec, the kit chemistry, standards and plate coating were all performing — the problem was on the sample side. That left two candidates: either 2,3-BPG in these dilutions was below the kit’s detection range, or something in the lysate was interfering with the assay. The flatlined readings and the negative value pointed firmly at interference.
The kit reports its result through an enzyme reaction: horseradish peroxidase (HRP) converts the TMB substrate to a blue product, which turns yellow when the acidic stop solution is added, and the plate is read at 450 nm. Endogenous peroxidase carried through in the lysate can catalyse that same TMB reaction on its own — producing colour that has nothing to do with the specific antigen–antibody competition. In a competitive format, that stray signal pushes wells to the extremes and destroys the dose-response, exactly as observed.
Root cause
Endogenous peroxidase activity in the RBC lysate. Because the ELISA reports signal through an HRP/TMB reaction, the peroxidase released when red cells are lysed competes with the assay chemistry and generates non-specific colour. The kit performed correctly — the standard curve proves it — but the unvalidated lysate matrix broke the detection step, giving flat, off-scale and negative readings that don’t reflect true 2,3-BPG levels.
What we recommended
Key takeaway
A perfect standard curve with nonsensical sample readings almost always means the matrix, not the kit, is the culprit. Endogenous peroxidase in RBC lysate is a classic interferent for any HRP/TMB ELISA. Validate every new sample type with spike-recovery and dilution-linearity before you trust the numbers — our ELISA Support Hub → walks through how.
Frequently asked questions
My standard curve is fine but samples all read the same high value — what’s wrong?
In a competitive ELISA, identical top-of-curve readings across different dilutions mean the assay isn’t seeing a real analyte gradient. That usually points to matrix interference or analyte outside the detection range — not a kit fault.
Why did red blood cell lysate cause interference?
Red cells carry endogenous peroxidase activity that is released on lysis. Because the kit detects signal through an HRP/TMB reaction, that peroxidase can generate colour independently of the specific antigen–antibody binding, distorting the readout.
Can I remove endogenous peroxidase from my sample?
Possibly. A hydrogen peroxide pre-treatment can quench peroxidase activity, but it is unvalidated for this assay and may damage antigen epitopes or affect the colour reaction. Always test treated samples against untreated controls before adopting it.
How do I know whether a sample type will work with an ELISA kit?
Start with the datasheet’s validated sample types, then run spike-and-recovery and linearity-of-dilution on your own matrix. Poor recovery or non-linear dilutions are a clear sign the matrix is interfering.
Related reading
ELISA Controls Guide: spike-recovery & matrix interference →
Calculating & Analyzing ELISA Data →
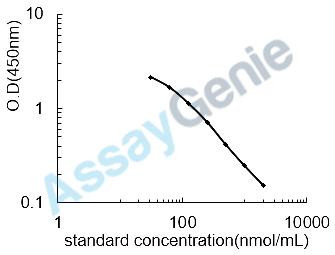
2,3-Bisphosphoglycerate (2,3-BPG) ELISA Kit →
SKU: UNEB0057 · Competitive ELISA
| Detection range | 31.2–2000 nmol/mL |
| Sample types | Serum, plasma, urine, CSF, cell culture supernatant, cell & tissue lysates, tissue homogenate, breast milk |
| Price | $857 |
Struggling with a tricky sample matrix?
Our technical support team reviews raw data and standard curves to get your ELISA back on track.
This post is based on an anonymised technical-support case and is provided for general guidance only. Data values are illustrative. Assay performance depends on your samples, handling and protocol — always validate new sample types in your own laboratory.
Recent Posts
-
Suspected Plague Death at a Siberian Anti-Plague Institute: What Researchers Should Know
Infectious Disease · News AnalysisSuspected Plague Death at a Siberian Anti-Plague Institute: What …6th Oct 2026 -
LPS ELISA Troubleshooting: The Importance of Sample Nature
Quick answer A researcher measuring circulating lipopolysaccharide (LPS) in human serum …25th Sep 2026 -

Sekundärantikörper wählen: Die Regel, die im Labor wirklich zählt
Sekundärantikörper wählen: Die Regel, die im Labor wirklich zählt Wählen Sie einen Sekundärantikörp …24th Sep 2026