
ELISA Plate-to-Plate OD Differences: Same-Lot Troubleshooting
When plates from the same lot give very different OD values, the cause is almost always a comparison problem, not a manufacturing problem. The three usual culprits are a truncated standard curve (top standard omitted), non-identical run conditions (different substrate development times), and a single plate compromised by a protocol deviation. Before concluding a kit is defective, rebuild every plate on the full standard curve under identical conditions — here, a PACAP ELISA on EDTA plasma with a 7.813–500 pg/mL range.
The problem
A researcher opened several kits from a single lot of a human PACAP ELISA (Pituitary Adenylate Cyclase-Activating Polypeptide) and ran EDTA plasma samples plus an in-house EDTA-plasma control across three plates. The plates disagreed sharply: two of them produced strong, consistent standard curves that matched our validation data, while the third gave standard and control ODs 5–10× lower for the same material and the same handling.
To complicate the read, the runs were not identical. One half-plate had a first-incubation deviation (performed at room temperature rather than the required 37 °C step), the standard curve had been set up with the top point omitted, and substrate development times varied from roughly 12 to 20 minutes between plates. Understandably, the researcher wanted to know whether one kit was faulty before spending limited patient material on the rest of the lot.
Snapshot of the data
The pattern is clearest at the raw-OD level, before any curve fitting. Below, a well-performing plate is compared against the low-signal plate. Note that the low plate was also missing the 500 pg/mL top standard.
| Standard (pg/mL) | Well-performing plate (OD450) | Low-signal plate (OD450) |
| 500 (top standard) | 2.61 | not run |
| 250 | 1.72 | 0.31 |
| 125 | 1.06 | 0.19 |
| 62.5 | 0.63 | 0.12 |
| 15.625 | 0.22 | 0.07 |
| Blank | 0.06 | 0.05 |
The in-house control told the same story from a different angle — it sat below the top standard on the low plate but above the top standard on the well-performing plates:
| Metric | Low-signal plate | Well-performing plates |
| Internal control OD450 | ~0.16 | ~2.9 |
| Position vs. top standard | Below curve | Above curve (out of range) |
| Substrate development | 20 min | 12–15 min |
Values are illustrative and rounded to show the pattern, not the researcher's exact readings.
Why it happens
Three independent factors made these plates look like different kits when they were really the same kit run three different ways.
1. A truncated standard curve. The kit ships a top standard (500 pg/mL for this lot) that is a genuine curve point, not just internal QC. When the top point is dropped, the curve tops out lower, high samples read out of range, and you lose the upper anchor that lets you line up one plate against another.
2. Non-identical run conditions. Signal in a colorimetric ELISA scales with substrate development time. Comparing a plate developed for 20 minutes against plates developed for 12–15 minutes at the raw-OD level is not a like-for-like comparison — and neither is comparing a plate whose first incubation ran at room temperature instead of 37 °C.
3. A compromised plate. A plate that missed its 37 °C capture-incubation step will always under-develop. Its low signal is the expected consequence of the deviation, not evidence that the kit is faulty.
Our analysis
The standard curve is the primary criterion we use to judge kit performance, and this lot passed release QC, where replicate wells must show a %CV under 10% to qualify. The two well-run plates matched our internal validation curve closely, which is exactly what a passing lot should do.
The low plate could not be validly compared against them: it carried the incubation deviation and was read against a shortened curve. Its 5–10× lower signal is fully consistent with those method differences. We also confirmed that the early blue tint the researcher saw in the fresh substrate trough — not in the wells — is harmless TMB oxidation on contact with air and metal; the wells themselves developed normally and the blank stayed low, so the substrate was fine.
Root cause
The apparent “kit-to-kit variability” was a comparison artifact. Plates were compared across a truncated standard curve and non-identical run conditions, with one plate compromised by a first-incubation deviation. Same-lot kits that pass QC do not swing 5–10× at the OD level on their own — the differences here trace to method, not manufacturing.
What we recommended
Key takeaway
Before you suspect a kit, make the plates comparable. A complete standard curve plus identical run conditions turns “the kits are inconsistent” into a clean, apples-to-apples read — and usually resolves the mystery. When you’re unsure, our ELISA Support Hub → walks through curve setup, %CV and out-of-range handling step by step.
Frequently asked questions
Should the top / stock standard be included in the curve?
Yes. The highest standard (500 pg/mL for this kit) is a real curve point, not just an internal QC reference. Omitting it shortens the analytical range and pushes high samples out of range.
My samples read above the top standard — what should I do?
Dilute and rerun so they fall inside the curve, ideally in its middle third. Extrapolating above the highest standard is not valid quantitation.
Can I compare plates run with different substrate incubation times?
Not at the raw-OD level. Optical density scales with development time, so a plate developed for 20 minutes will read higher than one developed for 12 even with identical samples. Keep the time fixed across plates you plan to compare.
Is early blue colour in the TMB trough a problem?
Usually not. TMB oxidises on contact with air and metal, so a faint tint in a fresh trough is cosmetic. What matters is that the wells develop normally and the blank stays low; a high blank is the sign to replace the substrate.
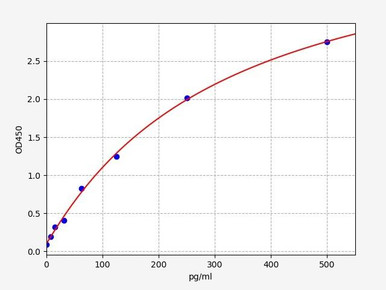
| Detection range | 7.813–500 pg/mL |
| Sensitivity | 4.688 pg/mL |
| Sample types | Serum, plasma, cell culture supernatant, cell or tissue lysate |
| Price | €649 |
Our PhD-level technical team will review your standard curve, %CV and OD data and help you make plates truly comparable.
This post is based on an anonymised technical-support case and is shared for general educational purposes. Illustrative OD values are shown to demonstrate the pattern and do not represent any specific customer’s data. Always follow the instructions supplied with your specific kit lot, and contact technical support for case-specific guidance.
Recent Posts
-
Suspected Plague Death at a Siberian Anti-Plague Institute: What Researchers Should Know
Infectious Disease · News AnalysisSuspected Plague Death at a Siberian Anti-Plague Institute: What …6th Oct 2026 -
LPS ELISA Troubleshooting: The Importance of Sample Nature
Quick answer A researcher measuring circulating lipopolysaccharide (LPS) in human serum …25th Sep 2026 -

Sekundärantikörper wählen: Die Regel, die im Labor wirklich zählt
Sekundärantikörper wählen: Die Regel, die im Labor wirklich zählt Wählen Sie einen Sekundärantikörp …24th Sep 2026