GenieHTS Sodium Flux Assay Kit
- SKU:
- ASIB005
- Product Type:
- Assay
- Research Area:
- Cell Biology
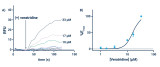
 Baseline subtracted, kinetic fluorescence data acquired using a Molecular Devices FlexStation® (Ex: 515 nm, Em: 545 nm, Cutoff: 530 nm) for all veratridine concentrations evaluated. Veratridine, an inhibitor of Nav channel inactivation, was added at 30 sec. B) Veratridine concentration response curve (CRC) in engineered HEK Nav1.3 cells. The estimated EC50 is 15 μM, and error bars represent standard deviation (n = 3).")
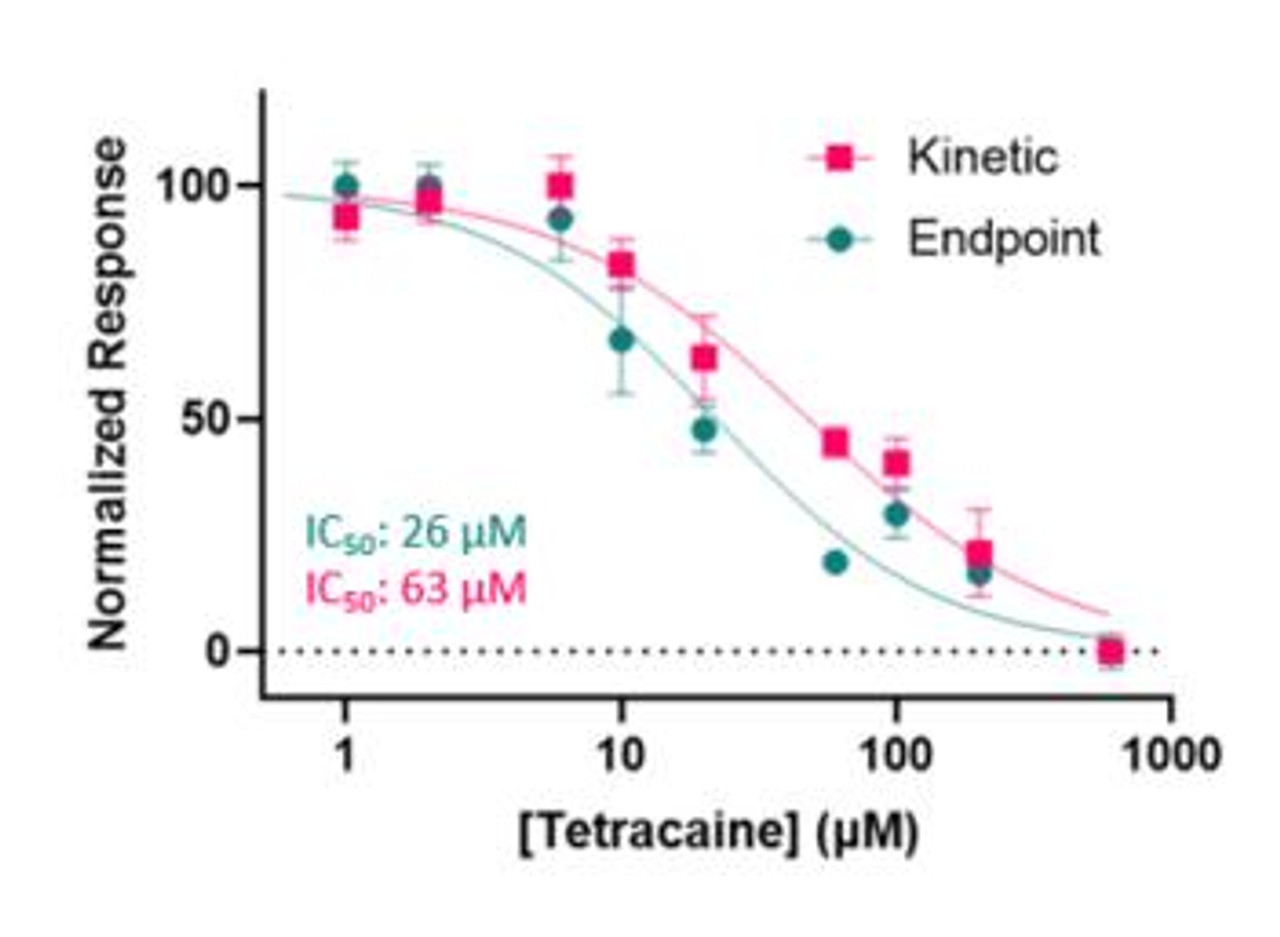
 in HEK Nav 1.3 cells measured using ING-2. Cells were exposed to tetracaine, a local anesthetic known the block voltage-gated sodium channels, for 10 min. prior to the addition of veratridine (33.3 μM). Fluorescence (Ex: 515 nm, Em: 555 nm, Cutoff: 550 nm) was recorded at ~1 Hz on a Molecular Devices FlexStation® plate reader for 1.5 min. after the addition of veratridine for “Kinetic” data (pink). For “Endpoint” data (blue), a Cytation 5 was used to collect fluorescence (Ex: 525 nm Em: 545 nm) 30 minutes after the addition of veratridine. Error bars represent SEM (n = 3).")
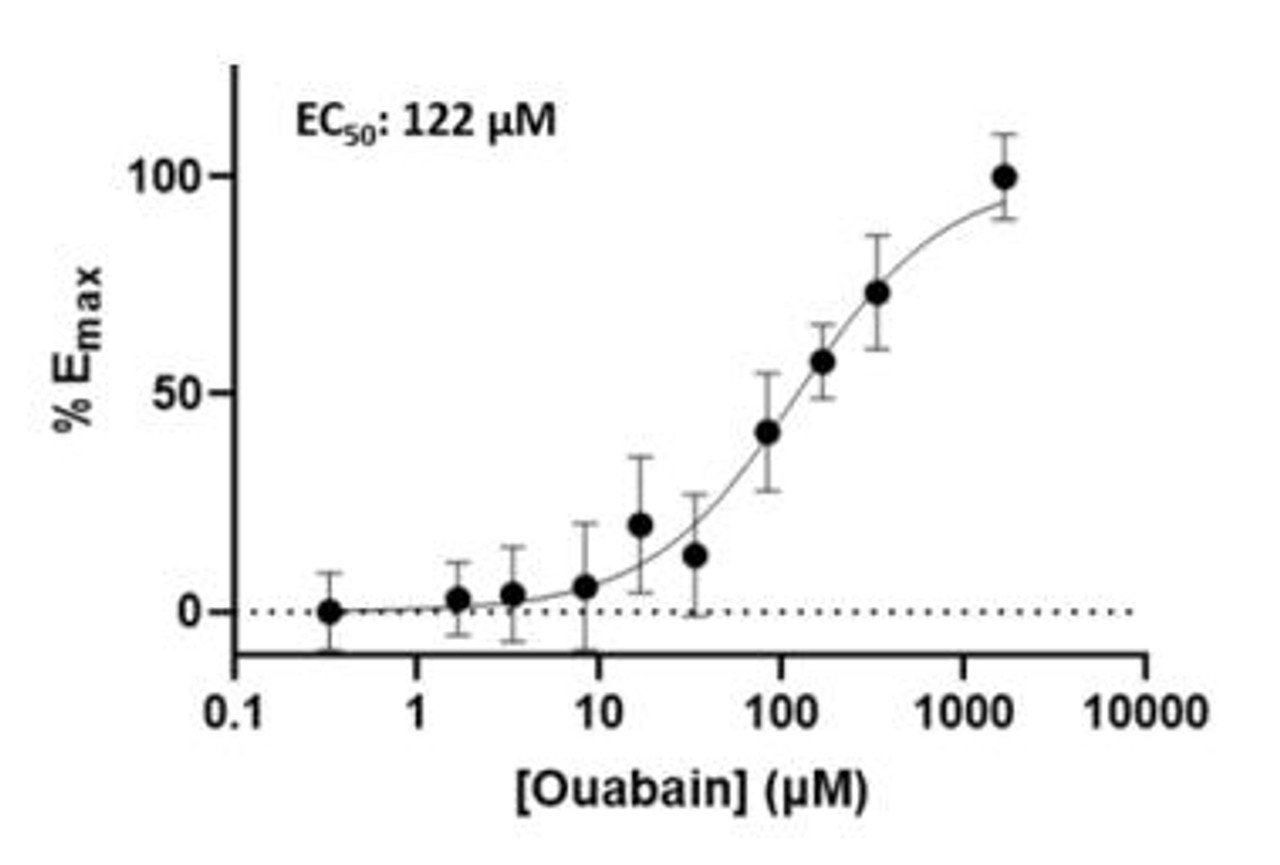
 in CHO K1 (WT) cells measured using ING-2 AM. Fluorescence (Ex: 525 nm, Em: 555 nm, Cutoff: 550 nm) was recorded at ~1 Hz using a Molecular Devices FlexStation® plate reader for 4.5 min. after the addition of ouabain, and (Fmax-F0) values were obtained. The estimated EC50 is 122 μM. Error bars represent standard deviation (n = 3).")
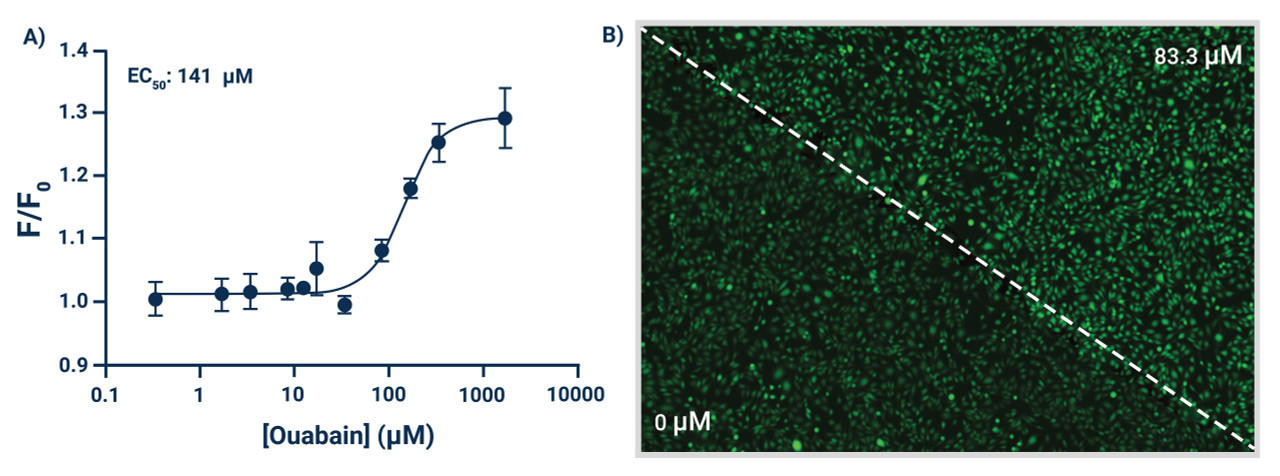
 Ouabain concentration response curve (CRC) in CHO K1 (WT) cells measured using ING-2. F/F0 were recorded 30 min. after the addition of ouabain using a Molecular Devices FlexStation® (Ex: 515 nm, Em: 545 nm, Cutoff: 530 nm). The measured EC50 is 141 μM, and error bars represent standard deviation (n = 3). B) Representative fluorescence images acquired ~35 min. after the addition of ouabain using a BioTek® Cytation equipped with a GFP filter cube (Ex: 469/35 nm, Em: 525/39 nm) and 4X objective. Corresponding ouabain concentrations are overlayed on each image, and increased fluorescence at higher concentrations of ouabain is observed. Scale bar is 1mm.")
![Figure 5: Increases in ING-2 fluorescence in response to [Na+ ]. A) Titration of ING-2 in 12.5 mM TRIS-Cl (pH = 7.4) buffer containing BSA (0.25 w/v%) and Mg2+ (1.2 mM) over a physiologically relevant range of [Na+ ] + [K+ ] concentrations. [Na+ ] + [K+ ] = 140 mM. B)Intracellular calibration of ING-2 loaded in CHO K1 cells. Calibrations were performed using gramicidin (5 μM) and fluorescence was recorded 90 min. after buffer exchange using a Cytation 5 plate reader. All data was normalized to the fluorescence (Ex: 525 nm, Em:545 nm) at [K+ ] = 135 mM and [Na+ ] = 5 mM. Error bars represent standard deviation (n = 3).](https://cdn11.bigcommerce.com/s-h68l9z2lnx/images/stencil/1280x1280/products/214053/558957/geniehts-sodium-flux-assay-kit__97944.1665193542.jpg?c=2&imbypass=on "Figure 5: Increases in ING-2 fluorescence in response to [Na+ ]. A) Titration of ING-2 in 12.5 mM TRIS-Cl (pH = 7.4) buffer containing BSA (0.25 w/v%) and Mg2+ (1.2 mM) over a physiologically relevant range of [Na+ ] + [K+ ] concentrations. [Na+ ] + [K+ ] = 140 mM. B)Intracellular calibration of ING-2 loaded in CHO K1 cells. Calibrations were performed using gramicidin (5 μM) and fluorescence was recorded 90 min. after buffer exchange using a Cytation 5 plate reader. All data was normalized to the fluorescence (Ex: 525 nm, Em:545 nm) at [K+ ] = 135 mM and [Na+ ] = 5 mM. Error bars represent standard deviation (n = 3).")
 Baseline subtracted, kinetic fluorescence data acquired using a Molecular Devices FlexStation® (Ex: 515 nm, Em: 545 nm, Cutoff: 530 nm) for all veratridine concentrations evaluated. Veratridine, an inhibitor of Nav channel inactivation, was added at 30 sec. B) Veratridine concentration response curve (CRC) in engineered HEK Nav1.3 cells. The estimated EC50 is 15 μM, and error bars represent standard deviation (n = 3).")
 in HEK Nav 1.3 cells measured using ING-2. Cells were exposed to tetracaine, a local anesthetic known the block voltage-gated sodium channels, for 10 min. prior to the addition of veratridine (33.3 μM). Fluorescence (Ex: 515 nm, Em: 555 nm, Cutoff: 550 nm) was recorded at ~1 Hz on a Molecular Devices FlexStation® plate reader for 1.5 min. after the addition of veratridine for “Kinetic” data (pink). For “Endpoint” data (blue), a Cytation 5 was used to collect fluorescence (Ex: 525 nm Em: 545 nm) 30 minutes after the addition of veratridine. Error bars represent SEM (n = 3).")
 in CHO K1 (WT) cells measured using ING-2 AM. Fluorescence (Ex: 525 nm, Em: 555 nm, Cutoff: 550 nm) was recorded at ~1 Hz using a Molecular Devices FlexStation® plate reader for 4.5 min. after the addition of ouabain, and (Fmax-F0) values were obtained. The estimated EC50 is 122 μM. Error bars represent standard deviation (n = 3).")
 Ouabain concentration response curve (CRC) in CHO K1 (WT) cells measured using ING-2. F/F0 were recorded 30 min. after the addition of ouabain using a Molecular Devices FlexStation® (Ex: 515 nm, Em: 545 nm, Cutoff: 530 nm). The measured EC50 is 141 μM, and error bars represent standard deviation (n = 3). B) Representative fluorescence images acquired ~35 min. after the addition of ouabain using a BioTek® Cytation equipped with a GFP filter cube (Ex: 469/35 nm, Em: 525/39 nm) and 4X objective. Corresponding ouabain concentrations are overlayed on each image, and increased fluorescence at higher concentrations of ouabain is observed. Scale bar is 1mm.")
![Figure 5: Increases in ING-2 fluorescence in response to [Na+ ]. A) Titration of ING-2 in 12.5 mM TRIS-Cl (pH = 7.4) buffer containing BSA (0.25 w/v%) and Mg2+ (1.2 mM) over a physiologically relevant range of [Na+ ] + [K+ ] concentrations. [Na+ ] + [K+ ] = 140 mM. B)Intracellular calibration of ING-2 loaded in CHO K1 cells. Calibrations were performed using gramicidin (5 μM) and fluorescence was recorded 90 min. after buffer exchange using a Cytation 5 plate reader. All data was normalized to the fluorescence (Ex: 525 nm, Em:545 nm) at [K+ ] = 135 mM and [Na+ ] = 5 mM. Error bars represent standard deviation (n = 3).](https://cdn11.bigcommerce.com/s-h68l9z2lnx/images/stencil/100x100/products/214053/558957/geniehts-sodium-flux-assay-kit__97944.1665193542.jpg?c=2 "Figure 5: Increases in ING-2 fluorescence in response to [Na+ ]. A) Titration of ING-2 in 12.5 mM TRIS-Cl (pH = 7.4) buffer containing BSA (0.25 w/v%) and Mg2+ (1.2 mM) over a physiologically relevant range of [Na+ ] + [K+ ] concentrations. [Na+ ] + [K+ ] = 140 mM. B)Intracellular calibration of ING-2 loaded in CHO K1 cells. Calibrations were performed using gramicidin (5 μM) and fluorescence was recorded 90 min. after buffer exchange using a Cytation 5 plate reader. All data was normalized to the fluorescence (Ex: 525 nm, Em:545 nm) at [K+ ] = 135 mM and [Na+ ] = 5 mM. Error bars represent standard deviation (n = 3).")
Description
GenieHTS Sodium Flux Assay Kit
GenieHTS Sodium Flux Assay Kit is the first high-throughput, no wash sodium channel assay designed to measure changes in intracellular sodium caused by effectors of sodium channels, sodium transporters, and non-selective cation channels.
| Product Name: | GenieHTS Sodium Flux Assay Kit |
| Product Code: | ASIB005 |
| Product Size: | 10 plates |
| Excitation: | 5250nm |
| Emission: | 545nm |
| Molecular Weight: | 1084 |
| Component Name | Size | Storage |
| GenieHTS Sodium Flux Indicator | Lyophilized (10) | -20°C |
| DMSO | 225μL | 4°C |
| Dye Solvent | 4mL | 4°C |
| 10X Sodium Assay Buffer | 20mL | 4°C |
| TRS | 4mL | 4°C |
| Probenecid Solution | 4mL | 4°C |
Materials needed but not provided
- Compounds to be tested.
- Buffers and solvents for dissolution.
- Reagents necessary for cell culture.
- A fluorescence plate reader ~ 490 nm /~ 520 nM.
- Plate reader capable of collect kinetic data (1 Hz) e.g. WaveFront Panoptic, Hamamatsu FDSS, Molecular Devices FLIPR and Molecular Devices FlexStation.
Sodium (Na+ ) is one of the most important monovalent metal cations in living organisms. Na+ channels, Na+ - permeable non-selective monovalent cation channels, and Na+ coupled transporters play critical roles including modulating neuronal activity, powering transport of nutrients and signaling molecules, and regulating solute balance. Na+ permeable channel and Na+ transporter-targeted drugs provide effective treatments for a diversity of indications: epilepsy, pain, bipolar disorder, depression, diuresis, and many others. As a result, interest in Na+ permeable channels and Na+ transporters as drug targets remains high. Assay Genies' GenieHTS Sodium Flux Assay is a total assay solution for multi-well plate-based, high-throughput measurements of changes in intracellular Na+ mediated through a wide-variety of plasma membrane and intracellular sodium channels and transporters. In multi-well, plate-based formats, the GenieHTS Sodium Flux Assay can be used to discover and characterize the effects of many tens-of-thousands of compounds and environmental factors on effectors of intracellular Na+.
The GenieHTS Sodium Flux Assay provides all the reagents necessary for use as a wash or no-wash assay with adherent or non-adherent cells. The optional use of a probenecid solution and an extracellular background masking solution (TRS) offers the ultimate in compatibility for cells types which are difficult to load with fluorescent Na+ indicators (e.g. Chinese Hamster Ovary, CHO cells) and when performing assays in complete, serum-containing cell culture medium is desired. Assay Genies' GenieHTS Sodium Flux Assay is compatible with fluorescence microscopes, flow cytometers, and plate readers capable of detecting fluorescein or more optimally, yellow fluorescent protein (YFP).
|
Figure 1: Measuring Nav1.3 activity using ING-2 in engineered HEK Nav1.3 cells. A) Baseline subtracted, kinetic fluorescence data acquired using a Molecular Devices FlexStation® (Ex: 515 nm, Em: 545 nm, Cutoff: 530 nm) for all veratridine concentrations evaluated. Veratridine, an inhibitor of Nav channel inactivation, was added at 30 sec. B) Veratridine concentration response curve (CRC) in engineered HEK Nav1.3 cells. The estimated EC50 is 15 μM, and error bars represent standard deviation (n = 3). |
|
Figure 2: Measuring Nav1.3 inhibition using ING-2 in engineered HEK Nav1.3 cells. Tetracaine concentration response curves (CRC) in HEK Nav 1.3 cells measured using ING-2. Cells were exposed to tetracaine, a local anesthetic known the block voltage-gated sodium channels, for 10 min. prior to the addition of veratridine (33.3 μM). Fluorescence (Ex: 515 nm, Em: 555 nm, Cutoff: 550 nm) was recorded at ~1 Hz on a Molecular Devices FlexStation® plate reader for 1.5 min. after the addition of veratridine for “Kinetic” data (pink). For “Endpoint” data (blue), a Cytation 5 was used to collect fluorescence (Ex: 525 nm Em: 545 nm) 30 minutes after the addition of veratridine. Error bars represent SEM (n = 3). |
|
Figure 3: Measuring Na+ /K+ -ATPase inhibition using ING-2. Ouabain concentration response curve (CRC) in CHO K1 (WT) cells measured using ING-2 AM. Fluorescence (Ex: 525 nm, Em: 555 nm, Cutoff: 550 nm) was recorded at ~1 Hz using a Molecular Devices FlexStation® plate reader for 4.5 min. after the addition of ouabain, and (Fmax-F0) values were obtained. The estimated EC50 is 122 μM. Error bars represent standard deviation (n = 3). |
|
Figure 4: Measuring Na+ /K+ -ATPase inhibition using ING-2 using an endpoint assay. A) Ouabain concentration response curve (CRC) in CHO K1 (WT) cells measured using ING-2. F/F0 were recorded 30 min. after the addition of ouabain using a Molecular Devices FlexStation® (Ex: 515 nm, Em: 545 nm, Cutoff: 530 nm). The measured EC50 is 141 μM, and error bars represent standard deviation (n = 3). B) Representative fluorescence images acquired ~35 min. after the addition of ouabain using a BioTek® Cytation equipped with a GFP filter cube (Ex: 469/35 nm, Em: 525/39 nm) and 4X objective. Corresponding ouabain concentrations are overlayed on each image, and increased fluorescence at higher concentrations of ouabain is observed. Scale bar is 1mm. |
|
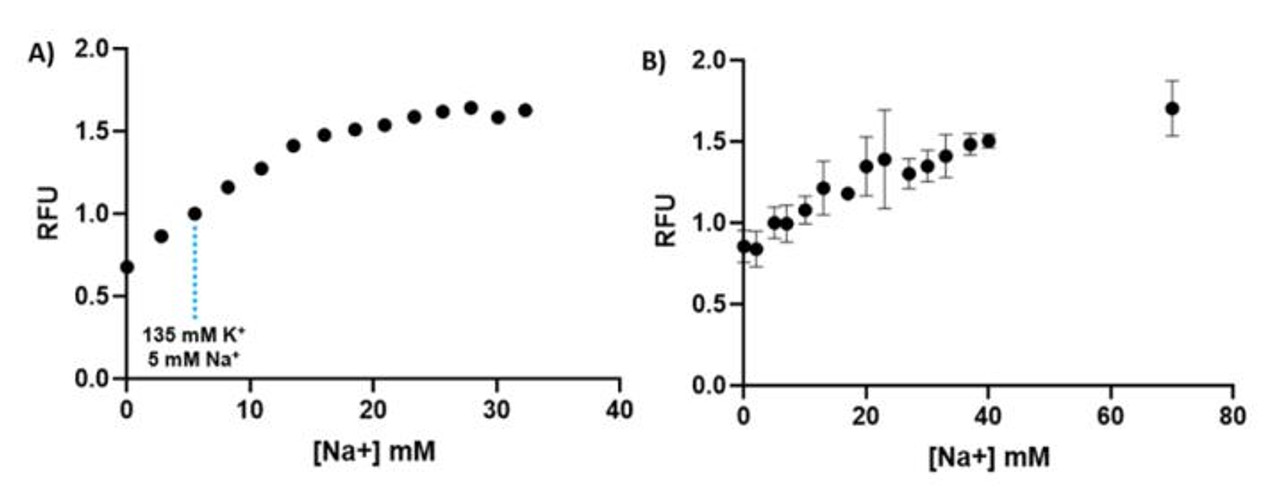
Figure 5: Increases in ING-2 fluorescence in response to [Na+ ]. A) Titration of ING-2 in 12.5 mM TRIS-Cl (pH = 7.4) buffer containing BSA (0.25 w/v%) and Mg2+ (1.2 mM) over a physiologically relevant range of [Na+ ] + [K+ ] concentrations. [Na+ ] + [K+ ] = 140 mM. B)Intracellular calibration of ING-2 loaded in CHO K1 cells. Calibrations were performed using gramicidin (5 μM) and fluorescence was recorded 90 min. after buffer exchange using a Cytation 5 plate reader. All data was normalized to the fluorescence (Ex: 525 nm, Em:545 nm) at [K+ ] = 135 mM and [Na+ ] = 5 mM. Error bars represent standard deviation (n = 3). |
Wash Method Adherent Cells
The instructions given below are for one, 384-well microplate. Certain aspects of the instructions may need to be altered, as appropriate, for multiple microplates or other assay formats (e.g. 96-well microplates or non-adherent cells). The Assay Genie Sodium Flux and Sodium Flux Indicator-containing solutions should be protected from direct light.
- Add 20 μL DMSO to the tube containing GenieHTS Sodium Flux Indicator.
- Vortex until GenieHTS Sodium Flux Indicator is fully dissolved.
- Add appropriate volume of water (Table 2) to a 15 mL centrifuge tube.
- Add 1 mL of 10X Assay Buffer to tube from step 3.
- Add 200 μL of Dye Solvent to the tube from step 4.
- If desired add 200 μL of Probenecid Solution to the tube from step 5.
- Add 20 μL of GenieHTS Sodium Flux Solution from step 2 to the tube from step 6.
- Briefly vortex the Dye Loading Solution, tube from step 7, to mix.
- Remove the cell-culture medium from the 384-well microplate containing the cells of interest.
- Add 20 μL per well of the Dye Loading Solution from step 8 to the microplate from step 9.
- Incubate the microplate containing the cells and Dye Loading Solution for 30 minutes - 1 hour at 37°C.
- Steps 12 - 15 are only required if a Dye Loading Solution without TRS (Method 3 in Table 2) is used. Prepare Wash Solution in a 15 mL centrifuge tube by adding the appropriate amounts of water, 10X Assay Buffer and other components if desired as shown in Table 3.
- Briefly vortex the tube from step 12 to mix.
- Remove Dye Loading Solution from microplate in step 11.
- Add 20 μL per well of the Wash Solution prepared in step 13 to the microplate from step 14.
- Transfer the dye-loaded, cell-containing microplate from step 11 or 15, along with an additional microplate containing a stimulus solution of interest, to a kinetic-imaging plate reader (e.g. WaveFront Panoptic, Hamamatsu FDSS, Molecular Devices FLIPR or Molecular Devices FlexStation).
- Acquire data using an excitation wavelength of ~ 520 nm***, an emission wavelength of ~ 545 nm and an acquisition frequency of ~1 Hz.**** Begin data acquisition and after 20 seconds add 5 μL of the 5X stimulus solution to the cell- containing plate and continue data acquisition for an additional 90 seconds*****.
***Excitation sources commonly used for fluorescein, Fluo-4, and GFP (480—490 nm) are also compatible with Sodium Flux Assay.
****For targets where changes in intracellular sodium concentrations are slow or sustained, an endpoint assay format can be used. We recommend acquiring data before the addition of stimulus (F0) and again 15-30 min after the addition of stimulus.
*****The timing of and volume of stimulus solution addition may vary. Some experiments may include the addition of other solutions to the cell-containing microplate prior to the addition of the stimulus solution. In these cases, the volume of the stimulus solution addition should be altered to account for the additional volume of solution in the cell-containing microplate.
Dye Loading Solution (Wash Method)
| Component | Method 1 | Method 2 | Method 3 |
| GenieHTS Sodium Flux Assay Kit | 20μL | 20μL | 20μL |
| Dye Solvent | 200μL | 200μL | 200μL |
| 10X Sodium Assay Buffer | 1mL | 1mL | 1mL |
| TRS* | 200μL | 200μL | - |
| Probenecid Solution** | - | 200μL | 200μL |
| Water | 8.4mL | 8.6mL | 8.6mL |
| Total | 10mL | 10mL | 10mL |
*TRS contains a membrane-impermeant dye useful for masking extracellular fluorescence. Caution is advised when using TRS or other extracellular masking solutions as they may have undesirable effects on assay performance for the target of interest.
** Probenecid may be included in the Dye Loading Solution to aid dye retention. This may be particularly important in certain cell lines (e.g. CHO cells). However, caution is advised when using Probenecid as it may have undesirable effects on assay performance for the target of interest.
Wash Solution (Wash Method)
| Component | Method 1 | Method 2 | Method 3 | Method 4 |
| 10X Sodium Assay Buffer | 1mL | 1mL | 1mL | 1mL |
| TRS* | - | 200μL | - | 200μL |
| Probenecid Solution | - | - | 200μL | 200μL |
| Water | 9mL | 8.8mL | 8.8mL | 8.6mL |
| Total | 10mL | 10mL | 10mL | 10mL |
*TRS contains a membrane-impermeant dye useful for masking extracellular fluorescence. Caution is advised when using TRS or other extracellular masking solutions as they may have undesirable effects on assay performance for the target of interest.
No-wash Method — Adherent Cells
- Add 20 μL DMSO to the tube containing GenieHTS Sodium indicator.
- Vortex until the Sodium Indicator Solution is fully dissolved.
- Add appropriate volume of water (Table 4) to a 15 mL centrifuge tube.
- Add 1 mL of 10X Sodium Assay Buffer to tube from step 3.
- Add 400 μL of Dye Solvent to the tube from step 4.
- Add 400 μL of TRS to the tube from step 5.
- If desired add 400 μL of Probenecid Solution to the tube from step 6.
- Add 20 μL of GenieHTS Sodium Indicator Solution from step 2 to the tube from step 7.
- Briefly vortex the tube from step 8 to mix.
- Add 20 μL per well of the Dye Loading Solution from step 9 to the cell-containing microplate. Do not remove the cell culture medium.
- Incubate the microplate containing the cells and Dye Loading Solution for 1 hour at 37°C in a cell culture incubator.
- Transfer the dye-loaded, cell-containing microplate from step 11, along with an additional microplate containing a stimulus solution of interest, to a kinetic-imaging plate reader (e.g. WaveFront Panoptic, Hamamatsu FDSS, Molecular Devices FLIPR or Molecular Devices FlexStation).
- Acquire data using an excitation wavelength of ~520 nm***, an emission wavelength of ~545 nm and an acquisition frequency of ~1 Hz.**** Begin data acquisition and after 20 seconds add 10 μL of the 5X stimulus solution to the cell- containing plate and continue data acquisition for an additional 90 seconds*****.
***Excitation sources commonly used for fluorescein, Fluo-4, and GFP (480—490 nm) are also compatible with Brilliant Sodium.
****For targets where changes in intracellular sodium concentrations are slow or sustained, an endpoint assay format can be used. We recommend acquiring data before the addition of stimulus (F0) and again 15-30 min after the addition of stimulus.
*****The timing of and volume of stimulus solution addition may vary. Some experiments may include the addition of other solutions to the cell-containing microplate prior to the addition of the stimulus solution. In these cases, the volume of the stimulus solution addition should be altered to account for the additional volume of solution in the cell-containing microplate.
Dye Loading Solution (No-wash Method)
| Component | Method 1 | Method 2 |
| GenieHTS Sodium Flux Assay Kit | 20μL | 20μL |
| Dye Solvent | 400μL | 400μL |
| 10X Sodium Assay Buffer | 1mL | 1mL |
| TRS* | 400μL | 400μL |
| Probenecid Solution** | - | 400μL |
| Water | 8.2mL | 7.8mL |
| Total | 10mL | 10mL |
*TRS contains a membrane-impermeant dye useful for masking extracellular fluorescence. Caution is advised when using TRS or other extracellular masking solutions as they may have undesirable effects on assay performance for the target of interest.
**Probenecid may be included in the Dye Loading Solution to aid dye retention. This may be particularly important in certain cell lines (e.g. CHO cells). However, caution is advised when using Probenecid as it may have undesirable effects on assay performance for the target of interest.
Related Products
 and with (B) 500 nM ionomycin.")


 or absence (-, bottom half of bar) of ~5.0 μM CsA. Cells that do not express the transporter, such as HeLa cells, do not show a change in fluorescence when CsA is added. Fluorescence (Ex: 495 nm, Em: 515 nm) was recorded on a BioTek® Cytation 5 plate reader. Images were acquired using GFP filters, Ex: 469/35 nm, Em: 525/39 nm, and 4X objective on a BioTek® Cytation 5. Reported ratios are calculated using fluorescence “bottom-read” data. Error bars represent standard deviation.")
 dose response curve generated from fluorescence data collected from CHO-K1 cells. Fluorescence (Ex: 495 nm, Em:515 nm) was recorded on a BioTek® Cytation 5 plate reader. Cells were incubated with Cyclosporine A for 30 min at 37 °C. Calcein was then added and cells were incubated for another 30 minutes at 37 °C. The estimated EC50 is 1.36 μM.")
 and dead (red) cellsstained using ION Vital - Viability kit. Image acquired using a 4X objective with GFP (calcein) and propidium iodide (EthD-I) filter cubes.")
, a known cytotoxic agent, for 24 hrs. N = 3 wells for all data points.")
 or FluxOR II Green (red) in no-wash mode (A) or washed mode (B) using the manufacturer’s instructions. Dye-loaded cells were exposed to either 0.1 mM or 0.5 mM Tl+ .")
