
Flow Cytometry Protocol | 10 Hints & Tips
Flow Cytometry Protocol: Two Worked Protocols, Controls and 10 Practical Tips
Flow cytometry measures individual cells in a fluid stream at hundreds per second, reporting size, granularity and fluorescence for each one. Most failures come not from the instrument but from sample preparation, panel design and controls. This guide gives two complete worked protocols, a full controls reference table, and ten practical points that determine whether the data is interpretable.
Browse flow cytometry reagents →Key takeaways
- Forward scatter correlates with particle size and side scatter with internal granularity; together they separate cell types and distinguish debris from intact cells.
- Detector gain is set on PMTs — photomultiplier tubes. Setting these correctly with unstained and fully stained controls comes before anything else.
- Match fluorochrome brightness inversely to antigen density: bright fluorochromes for low-abundance antigens, dim ones for highly expressed targets.
- Single-stained controls drive compensation; FMO controls set gates, because spillover from other channels shifts where the negative boundary truly sits.
- An isotype control must match the primary antibody’s species, isotype and fluorochrome — a human IgG1 control tells you nothing about a mouse IgG1 antibody.
- Always include a viability dye. Dead cells bind antibody non-specifically and generate false positive populations.
- Titrate every antibody. Using the manufacturer’s suggested volume without titration is the commonest cause of poor signal-to-noise.
Reagents for flow cytometry
A workable panel needs conjugates across separate detectors, a properly matched isotype control, and a viability dye — all three represented below.
![FITC Anti-Human CD3 Antibody [OKT-3]](https://cdn11.bigcommerce.com/s-h68l9z2lnx/products/20028/images/606504/fitc-anti-human-cd3-antibody-okt-3-agel0057__97655.1707498205.386.513.jpg?c=2)
FITC Anti-Human CD3 Antibody [OKT-3]
Pan-T lineage marker on the FITC detector; the anchor gate for most lymphocyte panels.
View product →![PE Anti-Human CD4 Antibody [RPA-T4]](https://cdn11.bigcommerce.com/s-h68l9z2lnx/products/20273/images/607117/pe-anti-human-cd4-antibody-rpa-t4-agel0400__93698.1707500206.386.513.jpg?c=2)
PE Anti-Human CD4 Antibody [RPA-T4]
Helper T cell marker; PE is bright, so it suits lower-density antigens.
View product →![APC Anti-Human CD184 / CXCR4 Antibody [12G5]](https://cdn11.bigcommerce.com/s-h68l9z2lnx/products/22329/images/607326/apc-anti-human-cd184cxcr4-antibody-12g5-agel1798__42972.1707500824.386.513.jpg?c=2)
APC Anti-Human CD184 / CXCR4 Antibody [12G5]
Surface receptor measured in Protocol 2; APC sits on the red laser, minimising spillover with FITC.
View product →![PE Mouse IgG1, kappa Isotype Control [MOPC-21]](https://cdn11.bigcommerce.com/s-h68l9z2lnx/products/229235/images/602088/pe-mouse-igg1-k-isotype-control-mopc-21-agel2550__87731.1706283557.386.513.jpg?c=2)
PE Mouse IgG1, kappa Isotype Control [MOPC-21]
Matches the species, isotype and fluorochrome of the PE-conjugated mouse antibodies above.
View product →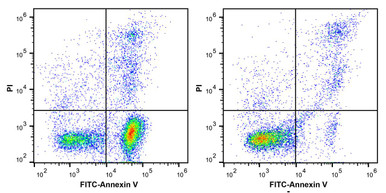
Propidium Iodide Staining Solution
Used for DNA content in Protocol 1, and as a viability dye in surface staining panels.
View product →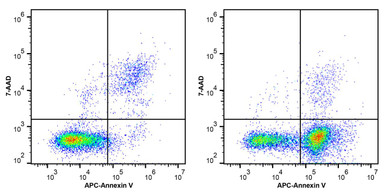
7-AAD Viability Staining Solution
Excluded by intact membranes; separates live from dead cells without the spectral breadth of PI.
View product →What flow cytometry measures
The name describes the method: flow for the moving stream, cyto for cells, metry for measurement. Cells in suspension pass single file through one or more laser beams, and detectors record scattered and emitted light from each event individually.
That single-cell resolution at high throughput — hundreds of events per second — is what distinguishes it from bulk assays. A western blot averages across a lysate; flow cytometry tells you what proportion of cells carry a marker and how much each one carries. It supports cell counting, sorting, biomarker detection, cell cycle analysis and apoptosis measurement.
Forward and side scatter
Two parameters are collected on every event before fluorescence is considered at all:
- Forward scatter (FSC) — light scattered at a shallow angle, correlating with particle size. Used to separate intact cells from smaller debris.
- Side scatter (SSC) — light scattered at ninety degrees, reflecting internal complexity and granularity.
Plotted together, FSC and SSC separate the major leukocyte populations without any staining at all — lymphocytes low on both, monocytes intermediate, granulocytes high on side scatter. Every gating strategy starts here.
Protocol 1: cell cycle analysis by propidium iodide staining
Fixes cells and stains DNA so that G1, S and G2/M populations can be resolved by DNA content.
Reagents and equipment
- Pipettes and tips
- Ethanol, 70% (v/v), ice-cold
- RNase A
- Phosphate buffered saline (PBS)
- Propidium iodide
- A flow cytometer
Fixation
- Harvest cells by centrifugation at 270 × g for 5 min to pellet.
- Carefully aspirate the supernatant without disturbing the pellet.
- Wash the pellet in ice-cold PBS.
- Centrifuge at 270 × g for 5 min.
- Resuspend in 200 µl PBS.
- Add 2 ml ice-cold 70% (v/v) ethanol dropwise while vortexing gently, then incubate at 4 °C overnight before analysis.
DNA staining
- Centrifuge fixed samples at 270 × g for 5 min.
- Aspirate the ethanol and resuspend in 500 µl PBS.
- Add RNase A and propidium iodide, and mix.
- Incubate in the dark at 37 °C for 30 min before analysis.
Why RNase is not optional: propidium iodide intercalates double-stranded RNA as well as DNA. Without RNase digestion the DNA content histogram is broadened and the cell cycle phases cannot be resolved cleanly.
Adding ethanol dropwise with gentle agitation also matters — adding it in bulk causes clumping, and clumps become the doublets discussed in tip 6.
Protocol 2: surface receptor expression
Measures the effect of a treatment on cell surface receptor levels — here CXCR4 on Jurkat T cells following SDF-1 alpha stimulation.
Reagents and equipment
- Pipettes and tips
- RPMI with 0.5% BSA
- SDF-1 alpha at 100 ng/ml
- Phycoerythrin (PE)-labelled antibodies against the receptor of interest
- PBS with 1% BSA
- 1% paraformaldehyde
- A flow cytometer
Stimulation and staining
- Seed Jurkat T cells at 5 × 10⁵ cells/ml and serum starve for 2 hours in serum-free RPMI with 0.5% BSA.
- Stimulate with 100 ng/ml SDF-1 alpha under discontinuous stirring.
- Stop the reaction by centrifugation for 30 sec at 850 × g on a benchtop centrifuge.
- Wash cells with ice-cold PBS.
- Stain with PE-labelled antibodies in 1% BSA/PBS and incubate 30 min on ice, protected from light.
- Wash twice with 1% BSA/PBS.
- Fix in 1% paraformaldehyde on ice.
- Store up to 24 hours at 4 °C protected from light, or analyse immediately.
Staining on ice throughout is deliberate: surface receptors internalise at 37 °C, so warm staining underestimates surface expression — which is precisely the measurement being made here.
Controls reference table
Controls fall into three groups: instrument set-up controls for voltages and compensation, gating controls to separate specific from non-specific signal, and experimental controls for biological meaning.
| Control | Use |
|---|---|
| Unstained Cells | Negative control to determine background & autofluorescence, Setting of PMT Voltages |
| Fully Stained Cells | Check for any off-scale events, Setting PMT voltages |
| Cell samples/beads stained with single fluorescent markers | Compensation, Gating – eliminating non-specific staining from analysis |
| Isotype control | Gating – eliminating non-specific staining from analysis |
| Fluorescence Minus One (FMO) staining | Gating – reduce fluorescence spillover |
| Unstimulated or untreated sample | Experimental negative control |
| Positive cells (stimulated) | Experimental positive control |
| Cells stained with a viability dye, e.g., propidium iodide | Discriminating viable from non-viable cells |
On isotype controls specifically: they are less informative than often assumed, and an FMO control is the better tool for setting a gate, because it accounts for spillover from every other channel in the panel rather than for non-specific binding alone. Where an isotype is used, it must match the primary antibody in species, isotype, fluorochrome and ideally protein-to-fluorochrome ratio.
Compensation and spillover
Fluorochromes emit across a range of wavelengths rather than at a single one, so light from one fluorochrome reaches detectors intended for others. That overlap is spillover, and correcting for it arithmetically is compensation.
- Compensation is calculated from single-stained controls — one per fluorochrome, on the same cells or on capture beads.
- The single-stained control must use the same fluorochrome as the panel, since spillover is a property of the dye, not the antibody.
- Compensation corrects the mean but cannot remove the added variance — spillover widens the spread of the data, which is why FMO controls remain necessary for gating even after compensation.
- Brighter is not always better: a very bright fluorochrome in a channel adjacent to a dim one can make the dim marker uninterpretable.
A standard gating order
| Step | Plot | Purpose |
|---|---|---|
| 1 | FSC-A vs SSC-A | Select the population of interest and exclude debris |
| 2 | FSC-H vs FSC-A | Exclude doublets — aggregates have disproportionate area relative to height |
| 3 | Viability dye vs SSC-A | Exclude dead cells, which bind antibody non-specifically |
| 4 | Lineage marker | Identify the population, for example CD3 for T cells |
| 5 | Marker of interest | Quantify expression, with the gate set using an FMO control |
Order matters. Gating a marker before excluding dead cells and doublets inflates the apparent positive fraction, and no amount of downstream analysis recovers from it.
Ten practical tips
1. Optimise sample preparation
This is where most experiments are won or lost. Harvesting must preserve viability, and any enzymatic dissociation must not cleave the epitopes being measured — trypsin removes several surface markers, so a gentler dissociation reagent is often required.
2. Match fixation and permeabilisation to the antigen
No single fixation and permeabilisation combination suits every target. Surface staining is generally done before fixation; intracellular targets need permeabilisation, and nuclear targets need a harsher method than cytoplasmic ones.
3. Choose fluorochromes against your instrument
Know the laser lines, filter sets and emission spectra available before designing a panel — no two cytometers are alike. Assign bright fluorochromes to low-density antigens and dim ones to highly expressed targets, and consider spillover when placing them.
4. Select the right controls
Use instrument controls for voltages and compensation, gating controls to distinguish specific from non-specific signal, and experimental controls for biological interpretation. The table above lists which control serves which purpose.
5. Identify and exclude dead cells
Dead cells bind antibody non-specifically and produce false positives. Include a dye excluded by intact membranes, such as propidium iodide or 7-AAD, and gate them out before analysing markers.
6. Gate out doublets
Doublets are two cells passing the laser together and being recorded as one event, falsely raising fluorescence intensity. Exclude them using height against area, or width against area, and filter samples before acquisition to reduce clumps.
7. Store samples correctly if you cannot run them immediately
Analyse fresh where possible. If not, resuspend in around 100 µl of fixative such as 1–2% formaldehyde and store at 4 °C protected from light for up to 24 hours.
8. Titrate every antibody
Manufacturer-recommended volumes are a starting point, not an answer. Titration — a dilution series scored on separation between positive and negative — improves signal-to-noise, and usually reduces antibody consumption as well.
9. Set compensation with single-stained controls
Use one single-stained control per fluorochrome, prepared with the same dye as the panel and at comparable brightness. Compensation corrects mean spillover but not the variance it adds, so keep FMO controls for gating.
10. Protect from light throughout
Fluorochromes photobleach under ambient light. Cover tubes and plates with foil during staining, incubation and storage, and keep exposure to a minimum during handling.
Choosing reagents
Conjugated antibodies across FITC, PE and APC, matched isotype controls, and propidium iodide and 7-AAD viability dyes.
Browse flow cytometry reagents →Frequently asked questions
What do FSC and SSC measure?
Forward scatter correlates with particle size and side scatter with internal granularity. Plotted together they separate major leukocyte populations and distinguish intact cells from debris, before any fluorescence is considered.
Why is RNase needed for propidium iodide cell cycle staining?
Because propidium iodide binds double-stranded RNA as well as DNA. Without RNase digestion the DNA histogram broadens and G1, S and G2/M cannot be resolved cleanly.
What is the difference between compensation and an FMO control?
Compensation arithmetically corrects mean spillover between detectors, using single-stained controls. An FMO control contains every fluorochrome except one and shows where the negative boundary actually falls in that channel — which compensation alone does not tell you.
Are isotype controls necessary?
They are less informative than often assumed. They address non-specific binding but not spillover, so an FMO control is generally the better gating tool. If used, an isotype must match the antibody’s species, isotype and fluorochrome.
How do I exclude doublets?
Plot height against area — for example FSC-H against FSC-A. A doublet produces roughly double the area for a similar height, so it falls off the diagonal. Filtering the sample before acquisition also reduces clumps.
Why stain surface markers on ice?
Because receptors internalise at 37 °C. Staining warm allows the target to be endocytosed during incubation, systematically underestimating surface expression.
Why titrate antibodies rather than use the recommended volume?
Because optimum concentration depends on cell number, staining volume and target density in your system. A titration series scored on positive-to-negative separation typically improves signal-to-noise and reduces reagent use.
Recent Posts
-
Suspected Plague Death at a Siberian Anti-Plague Institute: What Researchers Should Know
Infectious Disease · News AnalysisSuspected Plague Death at a Siberian Anti-Plague Institute: What …6th Oct 2026 -
LPS ELISA Troubleshooting: The Importance of Sample Nature
Quick answer A researcher measuring circulating lipopolysaccharide (LPS) in human serum …25th Sep 2026 -

Sekundärantikörper wählen: Die Regel, die im Labor wirklich zählt
Sekundärantikörper wählen: Die Regel, die im Labor wirklich zählt Wählen Sie einen Sekundärantikörp …24th Sep 2026