GeniePlex Flow Cytometer Instrument Set-Up
Flow cytometer setup guide
Instrument-specific configuration parameters, bead gating strategy, voltage and compensation tuning for GeniePlex multiplex immunoassay panels. Covers BD Biosciences, Beckman Coulter, Miltenyi Biotec, ACEA Biosciences, and Sony cytometers.
Quick-start configuration
Find your cytometer model in the table below. The four columns tell you exactly what to use for forward scatter, bead classification, reporter detection, and whether color compensation is required.
| Cytometer | Scatter | Bead Classification | PE Reporter | Compensation |
|---|---|---|---|---|
| BD FACSCalibur (single laser) | FSC | FL3 (670 nm) | FL2 (575 nm) | Required |
| BD FACSCalibur (dual laser) | FSC | FL4 (660 nm) | FL2 (575 nm) | Not required |
| BD Accuri C6 / C6 Plus | FSC | FL4 (660 nm) | FL2 (575 nm) | Not required |
| BD FACSCanto / Canto II | FSC | FL4 (660 nm) | FL2 (575 nm) | Not required |
| BD FACSArray | FSC | Red (660 nm) | Yellow (575 nm) | Not required |
| BD FACSVerse (2-laser, 6-color) | FSC | APC (660 nm) | PE (586 nm) | Not required |
| BD CyAn ADP | FS | FL8 (660 nm) | FL2 (575 nm) | Not required |
| BD FACSymphony A3 | FSC | APC (660 nm) | PE (586 nm) | Not required |
| BD FACSAria III | FSC | APC (660 nm) | PE (575 nm) | Not required |
| Miltenyi MACSQuant | FSC | B3/V1 (655–730 nm) | B2 (585 nm) | Not required |
| Beckman Coulter CyAn ADP | FS | FL8 (660 nm) | FL2 (575 nm) | Required (spectral overlap) |
| Beckman Coulter FC500 | FS | Red2 (660 nm) | FL2 (575 nm) | Required |
| Beckman Coulter CytoFlex | FSC | APC (660 nm) | PE (585 nm) | Not required |
| Sony EC800 | FS | FL4 (700 nm) | FL2 (575 nm) | Required |
For all listed instruments, configure the protocol to record both Area (A) and Height (H) parameters for every fluorescence channel used. Area-only acquisition limits downstream analysis flexibility.
Cytometer not listed? The platform is compatible with any flow cytometer that meets the minimum requirements described in the next section. Contact our technical team with your model number and we'll confirm channel assignments and provide configuration support.
Channel selection logic
If your cytometer isn't in the quick-start table, the principles below let you map the assay onto any compatible instrument.
Bead classification channel
GeniePlex capture beads carry a far-red fluorescent dye with peak emission near 700 nm. Detect it on whichever of these channels your instrument offers, in order of preference:
- PE-Cy5 channel with blue (488 nm) excitation — most common configuration, works on the majority of cytometers.
- APC channel with red (633 or 640 nm) excitation — preferred when available; gives cleaner separation from PE.
- PE-Cy7 channel with blue excitation — acceptable alternative when neither of the above is available.
PE reporter channel
The reporter dye is phycoerythrin (PE), with peak emission at ~575 nm and excitation by the blue (488 nm) laser. Use whichever channel your instrument designates as "PE", "FL2", or "Yellow" depending on the manufacturer's labelling convention.
If your instrument has both a PE-Cy5 channel (blue laser) and an APC channel (red laser), prefer APC for bead classification — the spectral separation from PE is wider on a separate laser line, reducing the need for compensation entirely.
Setup bead preparation
Before running samples, you'll prepare two setup tubes: blank beads for initial gating and PMT voltage tuning, and Standard 1 beads for verifying signal on the PE axis and applying compensation.
Blank beads
Aliquot half of the resuspended bead suspension from a Blank well (typically ~75 µL if the assay resuspension volume was 150 µL). Transfer to a sample tube or 96-well plate well, depending on your cytometer's sample loading mechanism. Add 100–300 µL of 1× Reading Buffer.
Remaining capture bead working suspension from the assay run can be substituted: 45 µL of the working suspension plus 100–500 µL of 1× Reading Buffer.
Standard 1 beads
Aliquot half of the resuspended bead suspension from a Standard 1 well (~75 µL). Add 100–300 µL of 1× Reading Buffer to the tube or plate well.
When running a panel for the first time on a given instrument, prepare one extra well of Standard 1. This gives you a fresh, full-strength setup sample for instrument tuning before consuming any of your actual standards or unknowns.
Volume note: If you add Reading Buffer to the Blank and Standard 1 wells directly (75–150 µL), bead concentration during acquisition will be lower and the run slightly slower — this is acceptable but plan your acquisition rate accordingly.
Display layout & voltage setup
Begin with instrument startup, fluidic stability verification, and optical alignment per your cytometer manufacturer's recommendations. Run calibration particles (e.g. Spherotech Rainbow Calibration Particles) before proceeding.
Create the protocol layout
Open a new acquisition protocol and create the following plots:
- One dot plot: FS (X-axis) × SS (Y-axis), linear display.
- Two histograms on the bead classification channel (PE-Cy5 or APC), log display.
- Two dot plots: PE (X-axis) × bead classification channel (Y-axis), log display.
- If both PE-Cy5 and APC (or PE-Cy7) channels are available, duplicate the histograms and PE dot plots for the second channel as well — useful for direct comparison.
Set all compensation values to zero at this stage. Enable acquisition of both Area and Height for all fluorescence parameters. Save the protocol.
Tune PMT voltages with blank beads
-
Adjust FS and SS gains
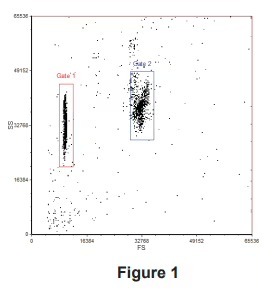
Run the prepared blank bead sample. Adjust forward and side scatter gains until both bead size populations are on-scale on the FS × SS plot.
-
Create gates for the two bead sizes
Draw Gate 1 around the smaller 4-micron beads (S4) and Gate 2 around the larger 5-micron beads (S5). Apply Gate 1 to one bead classification histogram and one PE × classification dot plot. Apply Gate 2 to the other set.
-
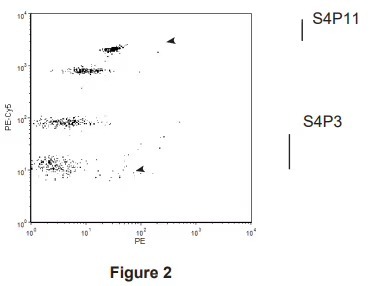
Adjust bead classification PMT voltage
Tune the PMT voltage on the bead classification channel until all peak populations within each gate are clearly resolved on the histograms and dot plots. For example, a typical S4 gate resolves four bead populations labelled S4P3, S4P7, S4P9, and S4P11, where P3 is the dimmest and P11 the brightest peak.
-
Adjust PE PMT voltage
Tune the PE channel voltage so the dimmest bead population sits within the first decade on the PE-axis. This ensures unstimulated samples generate measurable but unsaturated signal across the dynamic range.
-
Save the protocol
Saving at this point captures your tuned baseline before applying compensation in the next step.
Verify with Standard 1 beads
Run the prepared Standard 1 setup sample using the protocol saved in the previous section.
- Confirm all bead populations on the PE-axis are on-scale — none should be saturated at the upper limit of detection.
- If any population is off-scale, reduce the PE PMT voltage incrementally. After each adjustment, re-verify that the dimmest population is still visible above noise on the PE × classification dot plot.
- If you've adjusted PE voltage, plan to re-run Standard 8 (highest concentration standard) before acquiring samples, to confirm the top of the standard curve is also within range.
Standard 1 represents the lowest non-zero point on your standard curve. If its signal isn't cleanly resolved above background, every sample reading below it will be unreliable. Verifying Standard 1 separation before running samples saves having to re-run the plate.
Color compensation
Color compensation is required only on instruments where the bead classification dye (peak ~700 nm) spills into the PE channel (~575 nm). The quick-start table in Section 01 indicates which instruments require it.
Applying compensation
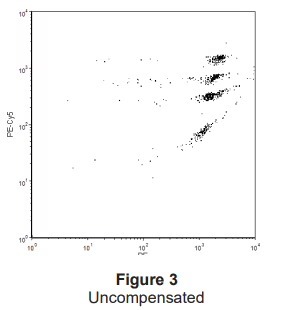
With Standard 1 beads running, adjust the % PE − classification channel compensation value until the bead populations sit in a horizontal orientation on the PE × classification dot plot — meaning bead position along the PE axis is independent of bead classification intensity.
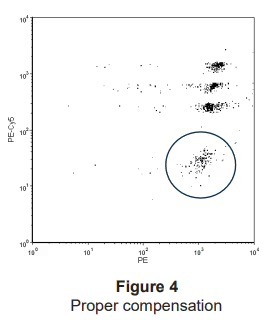
Over-compensation causes bead populations to slope downward from left to right, which can drag the dimmest signal below detection threshold and inflate apparent background. Compensate just enough to remove the visible spillover slope — no more.
Multi-channel setup
If you're configuring both PE-Cy5 and a secondary channel (PE-Cy7 or APC) for cross-validation or comparison, repeat the voltage tuning and compensation steps for each channel independently. Compensation between PE and APC is typically zero or minimal because the spectral separation is large.
Save the final protocol once compensation is set. Your instrument is now configured to acquire samples.
Validated configurations
The following table summarises cytometer/sample/analyte combinations published by GeniePlex users. Use it to confirm your intended configuration has direct precedent — or as a reference when designing a similar study. Gold-highlighted rows are from featured citations that explicitly cite GeniePlex in their methods.
Human samples
| Cytometer | Sample Type | Analytes |
|---|---|---|
| Beckman Coulter FC500 | Synovial fluid | MMP-7, MMP-1, IL-1β, CXCL9, IL-6, IL-8, IL-10, TNF-α, CXCL10, BDNF, NGFB, CCL2, CCL5, VEGF-A, IL-1RI |
| BD FACSCanto II | Serum | IFN-γ, IL-1β, IL-1RA, IL-4, IL-6, IL-10, IL-12, IL-17, MCP-1, MIP-1α, TNF-α |
| BD FACSVerse | Serum | CCL21, CCL18 (PARC), CCL19, CCL22 (MDC), CCL27 (CTACK), CXCL2, CXCL12 (SDF-1), CXCL16, CX3CL1 (Fractalkine) |
| BD FACSVerse | Serum | CCL21, CCL22 |
| BD FACSCanto II | Plasma | IL-1RA, MCP-1, MIP-1α, IP-10, IL-1β, IL-2, IL-6, IL-12p70, TNF-α, IFN-γ |
| BD LSR II | Dental cavity rinse | MMP-7, MMP-8, MMP-9 |
| BD Accuri C6 Plus | Serum | IFN-γ, IL-12p70, TNF-α, IL-2, IL-8, IL-4, IL-5, IL-9, IL-33, IL-6, IL-17A, IL-17F, IL-22 |
| Beckman Navios EX | Serum | Inflammation 18-Plex + Chemokine 7-Plex (combined run) |
| BD FACSVerse | Plasma | Inflammation 11-Plex (IFN-γ, IL-1α, IL-1β, IL-6, IL-8, IL-10, IL-12p70, IL-27, IP-10, MCP-1, TNF-α) |
| BD FACSCanto II | Plasma | IL-1β, IL-2, IL-4, IL-5, IL-6, IL-8, IL-10, IL-12p70, IL-17A, IL-17F, IL-22, TNF-α, TNF-β, IFN-γ, IL-1RA, IL-18, G-CSF, RANTES, MCP-1, IP-10, MIP-1α |
| BD FACSAria I | Plasma | IL-10, IL-15, IFN-γ |
| BD FACSCanto II | Serum | IL-10, IL-35 |
| BD FACSCanto II | Serum | IL-1β, IP-10, I-TAC, MIG, IL-15, MCP-1, sCD14, IL-6, IFN-α2, MIP-1β, G-CSF, sCD163 |
| BD FACSCalibur | Vitreous (undiluted) | Lipocalin-2 (LCN2/NGAL) |
| BD FACSAria II | Cell culture supernatant | IL-2, IL-4, IL-6, IL-10, TNF-α, IFN-γ |
| BD LSR II | Saliva supernatant | Inflammation 16-Plex (IFN-γ, IL-1α, IL-1β, IL-6, IL-8, IL-10, IL-12p70, IL-13, IL-17A, IL-27, IL-31, IL-33, IP-10, MCP-1, MIP-1α, TNF-α) |
| ACEA NovoCyte | Serum | TNF-α, IL-6 |
| Beckman Gallios | Plasma | IL-1β, IL-6, TNF-α, IL-10, CRP |
| BD FACSAria Fusion | Serum | IL-2, IL-4, IL-6, IL-7, IL-10, IL-15, IL-12p40, IFN-γ, TNF-α, GM-CSF, MIP-1α, MIP-1β, MCP-1, IP-10/CXCL10 |
| BD FACSCalibur | Serum | IL-4, IL-5, IL-13, IL-6, IL-17A, IL-23, TGF-β1 |
| BD FACSCanto II | Plasma | IL-6, MCP-1, sCD163, VCAM-1, adiponectin |
| BD FACSCanto II | Cell culture supernatant | Th1/Th2/Th17 7-Plex (IFN-γ, IL-2, IL-4, IL-6, IL-10, IL-17A, TNF-α) |
| BD FACScan | Plasma | sCD137 |
| BD FACSCalibur | Serum | IFN-γ, TNF-α, IL-1β, IL-2, IL-4, IL-5, IL-6, IL-8, IL-10, IL-12 |
| BD FACSCalibur | Serum | IFN-γ, IL-2, IL-4, IL-10, IL-17A, TNF-α, TGF-β1 |
| BD FACSVerse | BM-derived hMSC cultures | IGF-1, IGF-2 |
| BD FACSCalibur | Hofbauer cells (feto-placental macrophages) | Custom 23-plex panel |
| BD FACSCalibur | Plasma cells in culture media | IL-1RA, IL-6, IL-8 |
| BD FACSCalibur | Cell culture conditioned medium | FGF-2, VEGF |
| BD LSRFortessa | Tissue-conditioned medium | IL-1β, IL-6, IL-23p19 |
| ACEA NovoCyte | Cell culture supernatant | IFN-γ, IL-6, TNF-α |
| Beckman Navios | Cell culture supernatant | ICAM-1, IL-1β, IL-6, IL-8, MCP-1 |
| BD FACS Canto II | Ovarian cancer + NK cell co-culture supernatantSheedy et al. 2024 — Heliyon | Custom 4-plex: soluble TRAIL, IFN-γ, Granzyme A, Granzyme B |
| BD Accuri C6 Plus | Myofibroblast cell culture supernatantWard et al. 2024 — Acta Biomaterialia | Custom 5-plex: IL-1β, IL-10, IL-6, CTGF/CCN2, MCP-1/CCL2 |
| BD LSR Fortessa | ALI bronchial epithelium + monocyte co-cultureSimakou et al. 2024 — Discovery Immunology | Custom 14-plex + HUFI01701 PROS1 singleplex ELISA |
| Beckman FC500 | Synovial fluidPuts et al. 2024 — J Clin Med (knee osteoarthritis) | 11-plex + 3-plex + single-plex: IL-6, IL-8, IL-10, TNF-α, CXCL-10, BDNF, NGF, CCL2, CCL5, VEGF, IL-1RI, MMP-1, MMP-7, IL-1β, CXCL-9 |
| Miltenyi MACSQuant | Cell culture supernatantAl-Hourani et al. 2021 — TCR engineeringPreprint | IFN-γ, IL-2, TNF-α |
| Beckman Coulter CytoFlex | Serum (customer-validated) | Th1/Th2/Th17/Th9 18-plex: IL-1β, IL-5, IL-12p70, IL-17F, IL-22, TNF-β, IL-2, IL-4, IL-17A, IL-8, IFN-γ, IL-10, IL-6, TNF-α, GM-CSF, IL-9, IL-33, TSLP |
| Beckman Coulter CytoFlex | Serum (customer-validated, n=76) | Chemokine/Inflammation 24-plex: I-309, IL-1β, IL-10, IP-10, MIP-5, TNF-α, IL-2, IL-1RA, IFN-γ, IL-8, MIG, IL-12p70, MCP-1, TARC, I-TAC, IL-4, IL-5, IL-6, IL-17A, IL-13, IL-18, IL-33, CXCL16, MCP-4 |
Mouse samples
| Cytometer | Sample Type | Analytes |
|---|---|---|
| BD LSRFortessa | BAL supernatant | IL-1α, IL-1β, IL-1RA, IL-2Rα, IL-6, TNF-α, IFN-γ, CXCL1, CCL5 |
| BD FACSAria II | Serum | Inflammation 5-Plex (IL-1β, IL-6, IL-10, MCP-1, TNF-α) |
| BD LSR II | Plasma | IL-6, IL-10, MCP-1, TNF-α |
| BD FACSCalibur | Serum + kidney/liver lysate | TNF-α, IL-1β, IL-6, MCP-1 |
| BD FACSCalibur | Tissue lysate | TNF-α, IFN-γ, IL-6, VEGF |
| BD FACSCanto | Cell culture supernatant | IFN-γ, IL-1α, IL-1β, IL-6, IL-9, IL-10, IL-12p70, IL-13, IL-15, IL-23p19, IP-10, KC, MCP-1, MIP-1α, MIP-1β, RANTES, TNF-α |
| BD Accuri C6 Plus | Vaginal lavage | G-CSF, IL-1α, IL-1β, IL-6, IL-10, IL-17A, IL-22, IL-23p19, TNF-α |
| BD FACSCanto II | BM-derived dendritic cell supernatant | IL-12, IFN-γ, IL-6, IL-1β, IL-4, IL-13 |
| BD FACSCalibur | Peripheral blood | IFN-γ, IL-2, IL-4, IL-6, IL-10, IL-17A |
| BD FACSCalibur | Serum | CXCL1, CXCL2, IFN-γ, IL-6, IL-17A, TNF-α |
| BD FACSCalibur | Serum | IL-1β, IL-18, TNF-α, IL-6 |
| BD FACSArray | Mammary gland lysate + serum | KC, MIP-2 |
| BD FACSymphony A3 | Brain tissue homogenate (cortex + hippocampus)Da Silva et al. 2025 — Salk Institute (Alzheimer's / CK2)Preprint | Mouse Inflammation 7-plex Panel 1 (MOAMPM019): IL-6, MCP-1, IP-10, KC, TNF-α + 2 |
| BD FACSymphony A3 | Plasma + cell culture supernatantSpindola et al. 2025 — endothelial inflammatory memoryPreprint | Mouse Inflammation 17-plex (MOAMPM022) |
| BD FACSAria III | Serum + cell culture supernatantDandia et al. — cancer immunotherapy / scaffold lentiviral delivery | Th1 + Th17 (MOAMPM015): IL-2, IFN-γ, TNF-α, IL-17A, IL-21, IL-22 |
| BD FACSAria II | 3D multicellular liver spheroid supernatantvan Os et al. 2022 — Biomaterials (NAFLD/NASH modelling) | Mouse Inflammation 5-plex Panel 1 (MOAMPM016): IL-6, TNF-α, MCP-1 + 2 |
| BD Accuri C6 | Mouse serum (syngeneic breast cancer)Correia et al. — Cell Press — Claudin-6 / breast cancer | Mouse 3-plex (MOAMPM008): IL-6, IL-10, IL-2 |
| Beckman Coulter CyAn ADP | Plasma (with spectral overlap compensation)Zhuang et al. 2025 — Adv Healthcare Materials — MOF nanomedicine | Mouse Inflammation 17-plex (MOAMPM022) |
Rat samples
| Cytometer | Sample Type | Analytes |
|---|---|---|
| BD FACSCalibur | Serum | IL-17, IL-10, TGF-β |
| BD LSRFortessa | Serum | IL-4, IL-6, IL-10, TNF-α |
| ACEA NovoCyte | Peripheral blood + brain tissue | IL-1β, IL-6, TNF-α, IFN-γ, IL-4, IL-10 |
| BD FACSCalibur | Serum | IL-2, IL-4, IL-6, IL-10, IL-17A, IFN-γ, TNF-α |
| BD FACSCanto II | Plasma | IL-2, IL-6, IL-10, IL-17A, TGF-β1 |
| BD LSRFortessa | Plasma | CCL5, CCL11, IL-4, IL-6 |
| ACEA NovoCyte | Plasma | IFN-γ, IL-1β, IL-4, IL-6, IL-10 |
| BD FACSCalibur | Serum + tumor tissue | TNF-α, IL-1β |
| ACEA NovoCyte | Kupffer cells (in vitro) | TNF-α, IL-1β, IL-6 |
| BD Accuri C6 | Muscle tissue homogenateMarciano et al. — rat skeletal muscle pharmacology | Custom rat 8-plex |
Troubleshooting
Common setup issues and how to resolve them. If your problem isn't listed here, contact technical support with your instrument model, panel SKU, and a screenshot of the affected plot.
Bead populations not clearly separated on classification histogram
Increase the PMT voltage on the bead classification channel until peak separation is clean. If populations remain merged at high voltage, check that you're using the correct channel (PE-Cy5 with blue excitation or APC with red excitation, not PE) and that the laser is properly aligned per your manufacturer's QC procedure.
Dimmest bead population falls below detection on PE axis
This usually indicates either over-compensation or PE PMT voltage set too low. First, reduce compensation in 1–2% increments and observe whether the dim population reappears. If not, gradually increase PE voltage while monitoring that the brightest standard population (Standard 8) does not saturate.
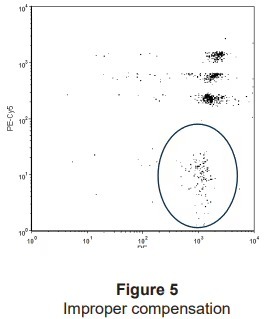
Bead populations slope diagonally on PE × classification plot
This is classic spectral spillover — fluorescence from the bead classification dye is appearing in the PE channel. Apply % PE − classification channel compensation incrementally until the populations sit horizontally. Over-compensation causes a downward slope; under-compensation leaves an upward slope.
Acquisition rate is unusually slow
Most often caused by adding too much Reading Buffer relative to bead volume, which dilutes the sample. For setup beads, use 100–300 µL of buffer rather than 500 µL. For sample wells, ensure the resuspension volume in the final assay step matches the panel's recommended value. Persistent slow rates can also indicate clogged fluidics — run a cleaning cycle and recheck.
Standard curve does not fit expected range
Verify the PE PMT voltage was tuned before running standards, not after. If voltage was changed mid-run, re-acquire the standards. Confirm Standard 8 is on-scale at the upper end and Standard 1 is clearly resolved from Blank at the lower end. If both endpoints look correct but intermediate points are inconsistent, check standard reconstitution and serial dilution accuracy.
Reading channels labelled differently than my cytometer
Manufacturer channel labels vary. Match by emission wavelength rather than label:
- Bead classification: any channel reading ~670–700 nm emission
- PE reporter: any channel reading ~575–586 nm emission with 488 nm excitation
Contact technical support if you're unsure which channels on your instrument meet these criteria.
High background on Blank wells
Most commonly caused by insufficient washing during the assay or compensation drift. Re-run the Blank well after a fresh wash cycle. If background persists, verify that no PE reporter signal contamination exists in your Blank wells (a Blank well containing residual detection antibody will show elevated PE signal).
Different results across days on the same instrument
Run Spherotech Rainbow Calibration Particles at the start of each session and adjust PMT voltages to match a saved baseline. Day-to-day drift in laser power or detector sensitivity is normal; calibration particles let you compensate before running the assay.