
Fluorescence Resonance Energy Transfer (FRET) Assays: An Insight into Molecular Interactions
FRET Assays: Principle, Förster Radius and Measurement Methods
FRET transfers energy from an excited donor fluorophore to a nearby acceptor without emitting a photon, and the efficiency falls with the sixth power of the distance between them. That steep dependence is what turns a fluorescence measurement into a molecular ruler with 1–10 nm resolution. This guide covers the physics, how to choose a pair, the four ways FRET is measured, and the controls that separate real signal from bleed-through.
Browse fluorescence assays →Key takeaways
- FRET is non-radiative — energy passes by dipole-dipole coupling, not by the donor emitting a photon that the acceptor absorbs. That distinction matters for how it is interpreted.
- Efficiency follows E = R06 / (R06 + r6). The sixth-power term makes it switch sharply over a narrow distance range.
- R0, the Förster radius, is the separation giving 50% transfer — typically 4–6 nm for common pairs. It is the single number that defines a pair’s useful range.
- Because it operates on the scale of protein dimensions, Stryer called it a spectroscopic ruler — sensitive to distances no optical microscope can resolve.
- A workable pair needs spectral overlap of donor emission with acceptor absorption, a bright photostable donor, and minimal direct excitation of the acceptor at the donor wavelength.
- Spectral bleed-through is the central practical problem. Donor-only and acceptor-only controls are mandatory, not optional.
- Acceptor photobleaching and FLIM avoid bleed-through corrections entirely, which is why they are considered the more rigorous readouts.
Fluorescence-based assays and labels
Assay Genie does not currently list FRET-specific kits. The reagents below are the closest genuine relatives — quenched fluorogenic substrates, which work on the same donor-quencher principle, and the fluorophore labels FRET experiments depend on.
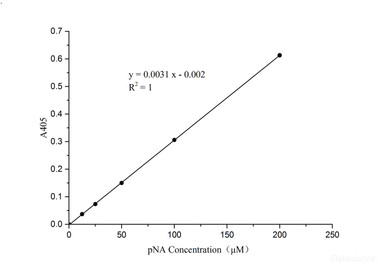
Caspase 3/7 Activity Assay Kit
A quenched substrate released by cleavage — mechanistically the same logic as a FRET protease reporter.
View product →
ACE2 Fluorometric Inhibitor Screening Kit
Enzyme-cleavable fluorogenic substrate in a plate format, the standard configuration for inhibitor screens.
View product →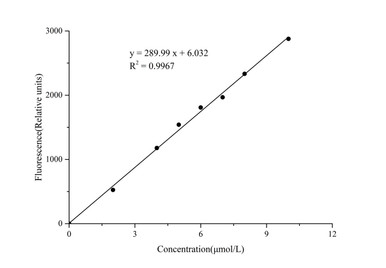
Lipoxygenase (LOX) Activity Fluorometric Assay Kit
Fluorescence-based activity readout for continuous kinetic measurement.
View product →
GenieFluor 488 Goat Anti-Mouse IgG (H+L)
A green-emitting conjugate in the donor range, pairing with red acceptors around 550–570 nm.
View product →![Anti-GFP Antibody [H24]](https://cdn11.bigcommerce.com/s-h68l9z2lnx/products/279997/images/773940/anti-gfp-antibody-h24__71211.1785551847.386.513.jpg?c=2)
Anti-GFP Antibody [H24]
For validating expression of fluorescent protein fusions used in genetically encoded FRET biosensors.
View product →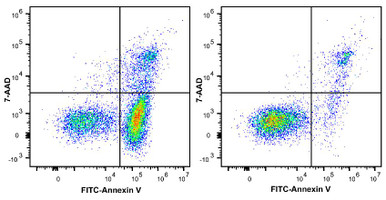
Annexin V-FITC / 7-AAD Apoptosis Kit
A two-colour assay where spectral overlap must be compensated — the same problem FRET must control for.
View product →The physical principle
An excited donor fluorophore can lose its energy in several ways — by emitting a photon, by non-radiative decay, or, if a suitable acceptor is close enough, by transferring that energy directly to the acceptor.
That transfer is non-radiative. No photon is emitted and reabsorbed; the two molecules couple through their transition dipoles, in the same way two tuning forks at matched pitch exchange vibration. The acceptor then emits at its own longer wavelength, having never been directly illuminated.
The observable consequences are simultaneous and complementary: donor emission falls, acceptor emission rises, and the donor’s excited-state lifetime shortens. Each of those gives a different way to measure the same event.
Distance dependence and the Förster radius
This is the part that makes FRET useful, and the original version of this article did not state it. Transfer efficiency is:
E = R06 / (R06 + r6)
where r is the donor-acceptor separation and R0 is the Förster radius — the distance at which transfer is exactly 50% efficient.
| Separation | Efficiency | Interpretation |
|---|---|---|
| 0.5 × R0 | ~98% | Near-complete transfer; saturated and insensitive to further change |
| R0 | 50% | Maximum sensitivity to distance change — the ideal working point |
| 1.5 × R0 | ~8% | Weak but detectable |
| 2 × R0 | ~1.5% | Effectively no signal |
Because efficiency scales with r−6, doubling the distance cuts transfer roughly sixty-four-fold. FRET is therefore close to a binary readout across a narrow window: it reports convincingly on whether two labels are within about 1.5 R0, and says almost nothing beyond that.
Typical R0 values are 4 to 6 nm — the scale of a protein. That coincidence is why Stryer and Haugland described FRET as a spectroscopic ruler: it measures distances an optical microscope cannot resolve, because it does not rely on optical resolution at all.
R0 itself depends on the spectral overlap integral, the donor quantum yield, the refractive index of the medium, and the orientation factor κ2. In practice κ2 is assumed to be 2/3, which holds when both fluorophores tumble freely. If either is rigidly held, that assumption fails and the calculated distance may be wrong — a real limitation when labels are fused directly to structured protein domains.
What makes a workable FRET pair
- Spectral overlap. The donor emission spectrum must overlap the acceptor absorption spectrum. Too little overlap and R0 is too small to be useful.
- Separable emission. The two emission peaks must be far enough apart to distinguish. This pulls against the first requirement, and balancing the two is the core of pair selection.
- Minimal direct acceptor excitation. The acceptor should absorb weakly at the donor excitation wavelength, or apparent FRET will simply be the acceptor being excited directly.
- High donor quantum yield and good acceptor extinction coefficient, both of which raise R0.
- Photostability, particularly for the donor, since photobleaching during acquisition mimics changing FRET.
- Appropriate distance. The expected separation should sit near R0. A pair with R0 of 5 nm tells you little about a 15 nm interaction.
Common donor-acceptor pairs
| Donor | Acceptor | Approx. R0 | Typical use |
|---|---|---|---|
| CFP | YFP | ~4.9 nm | The classic genetically encoded pair for biosensors |
| mTurquoise2 | mVenus | ~5.7 nm | Improved brightness and photostability over CFP/YFP |
| EGFP | mCherry | ~5.2 nm | Widely used where green and red channels are already established |
| Cy3 | Cy5 | ~5.4 nm | The standard organic pair for single-molecule FRET |
| Alexa 488 | Alexa 555 | ~7.0 nm | Bright and photostable for antibody labelling |
| Fluorescein | Tetramethylrhodamine | ~5.5 nm | Long-established pair for labelled peptides and oligonucleotides |
Genetically encoded pairs allow labelling inside living cells with no exogenous dye, at the cost of a bulky tag that can perturb the protein and constrain fluorophore orientation. Organic dyes are smaller and brighter but must be conjugated and delivered.
Dark quenchers are a useful third option. An acceptor that absorbs but does not emit — as in a molecular beacon — gives a clean single-channel readout with no bleed-through to correct.
Four ways to measure FRET
| Method | What is measured | Trade-off |
|---|---|---|
| Sensitised emission | Acceptor emission under donor excitation, as a ratio | Fastest and works live, but requires bleed-through correction with separate single-label controls |
| Acceptor photobleaching | Donor brightness before and after destroying the acceptor | Unambiguous and needs no correction, but destructive and therefore single-timepoint only |
| Fluorescence lifetime imaging (FLIM) | Shortening of the donor excited-state lifetime | The most rigorous — lifetime is concentration-independent — but needs specialised instrumentation |
| Anisotropy / homo-FRET | Depolarisation of emission between identical fluorophores | Detects clustering of like molecules, which intensity methods cannot |
The essential distinction is that sensitised emission measures an intensity, which depends on how much fluorophore is present, whereas FLIM measures a lifetime, which does not. That independence from concentration is why FLIM is treated as the reference method.
Controls and artefacts
Most spurious FRET results come from a small number of well-understood sources.
- Donor bleed-through — donor emission leaking into the acceptor channel. Corrected using a donor-only sample.
- Direct acceptor excitation — the donor excitation wavelength exciting the acceptor. Corrected using an acceptor-only sample.
- Concentration artefacts — at high labelling density, molecules come within R0 by chance rather than by interaction. Titrate to confirm the signal is not concentration-dependent.
- Photobleaching during acquisition, which changes the donor-acceptor ratio over time and mimics changing FRET.
- Orientation effects — rigidly held fluorophores violate the κ2 = 2/3 assumption, so an absence of FRET can reflect unfavourable orientation rather than distance.
Two controls are non-negotiable: a donor-only and an acceptor-only sample. A negative control with the labels on non-interacting proteins, and a positive control with them tethered at a fixed short distance, make interpretation considerably safer.
Applications
- Protein-protein interactions in live cells, with the spatial and temporal resolution that co-immunoprecipitation cannot provide.
- Conformational change. Labelling two points on one protein reports domain movement — the basis of much of what is known about transporter and receptor mechanics.
- Protease activity. A donor and acceptor flanking a cleavage site give a signal that changes on cleavage; caspase reporters are the familiar example.
- Genetically encoded biosensors. Cameleon calcium sensors and Epac-based cAMP sensors both use conformational change to alter FRET efficiency.
- Nucleic acid structure and dynamics — hybridisation, folding, and the action of helicases and polymerases.
- Molecular beacons — hairpin probes holding a fluorophore against a quencher until target binding separates them.
Related techniques: BRET, TR-FRET and smFRET
| Technique | Difference | Advantage |
|---|---|---|
| BRET | The donor is a luciferase; energy comes from a chemical reaction, not excitation light | No excitation source, so no photobleaching, no autofluorescence and no direct acceptor excitation |
| TR-FRET / HTRF | A long-lifetime lanthanide donor with a time-delayed measurement | The delay lets short-lived background autofluorescence decay first — the standard format for high-throughput screening |
| smFRET | Single immobilised molecules observed individually | Resolves conformational subpopulations and transitions that ensemble averaging hides entirely |
The single-molecule variant changed what the technique can answer. An ensemble measurement returns a mean; if half a population sits in each of two conformations, the mean describes a state that no molecule actually occupies. smFRET shows the distribution instead.
References
- Förster, T. (1948). "Intermolecular energy migration and fluorescence." Annals of Physics, 2(1-2), 55-75.
- Wu, P., & Brand, L. (1994). "Resonance energy transfer: Methods and applications." Analytical Biochemistry, 218(1), 1-13.
- Jares-Erijman, E. A., & Jovin, T. M. (2003). "FRET imaging." Nature Biotechnology, 21(11), 1387-1395.
- Koushik, S. V., & Vogel, S. S. (2008). "Energy transfer sensitized fluorescence of biopolymers." Chemical Reviews, 108(12), 5497-5518.
- Roy, R., Hohng, S., & Ha, T. (2008). "A practical guide to single-molecule FRET." Nature Methods, 5(6), 507-516.
- Stryer, L., & Haugland, R. P. (1967). "Energy transfer: a spectroscopic ruler." Proceedings of the National Academy of Sciences, 58(2), 719-726.
- Lakowicz, J. R. (2006). Principles of Fluorescence Spectroscopy. 3rd ed. Springer.
- Tsien, R. Y. (1998). "The green fluorescent protein." Annual Review of Biochemistry, 67, 509-544.
- Piston, D. W., & Kremers, G. J. (2007). "Fluorescent protein FRET: the good, the bad and the ugly." Trends in Biochemical Sciences, 32(9), 407-414.
Choosing reagents
Fluorogenic activity assays working on the donor-quencher principle, fluorophore-conjugated secondaries, and anti-GFP for validating fluorescent protein fusions.
Browse fluorescence assays →Frequently asked questions
What is the Förster radius?
The donor-acceptor separation at which transfer efficiency is exactly 50%. Typically 4 to 6 nm for common pairs, it defines the usable range — FRET is most sensitive to distance change near R0 and effectively undetectable beyond about twice it.
Why is FRET described as a molecular ruler?
Because efficiency depends on the sixth power of distance over a 1 to 10 nm range — the scale of protein dimensions. It reports distances far below optical resolution, since it does not depend on resolving the two molecules at all.
Does the donor emit a photon that the acceptor absorbs?
No. FRET is non-radiative: the two fluorophores couple through their transition dipoles and energy passes directly. Emission and reabsorption is a separate phenomenon with different distance behaviour.
What controls does a FRET experiment need?
Donor-only and acceptor-only samples at minimum, to correct bleed-through and direct acceptor excitation. A negative control with labels on non-interacting proteins and a positive control with them held at a fixed distance make the result far more interpretable.
Which measurement method is most reliable?
FLIM, because donor lifetime is independent of fluorophore concentration and needs no bleed-through correction. Acceptor photobleaching is also unambiguous but destructive. Sensitised emission is fastest and works live, at the cost of requiring correction.
Can I conclude two proteins do not interact if I see no FRET?
Not safely. Absence of FRET can mean the labels are more than about 1.5 R0 apart, or that their relative orientation is unfavourable, even while the proteins are genuinely bound. Negative FRET results are weaker evidence than positive ones.
What is the difference between FRET and TR-FRET?
TR-FRET uses a long-lifetime lanthanide donor and measures after a delay, so short-lived background autofluorescence has decayed. That improves signal-to-noise substantially and makes it the usual choice for high-throughput screening.
Tehreem Ali completed her MS in Bioinformatics and conducted her research work at the IOMM lab at GCUF, Pakistan.
Recent Posts
-
Suspected Plague Death at a Siberian Anti-Plague Institute: What Researchers Should Know
Infectious Disease · News AnalysisSuspected Plague Death at a Siberian Anti-Plague Institute: What …6th Oct 2026 -
LPS ELISA Troubleshooting: The Importance of Sample Nature
Quick answer A researcher measuring circulating lipopolysaccharide (LPS) in human serum …25th Sep 2026 -

Sekundärantikörper wählen: Die Regel, die im Labor wirklich zählt
Sekundärantikörper wählen: Die Regel, die im Labor wirklich zählt Wählen Sie einen Sekundärantikörp …24th Sep 2026