Cellular Respiration: Stages, ATP Production & Pathway Guide
Cellular Respiration: Stages, ATP Production & Pathway Guide
How cells convert glucose and oxygen into ATP across four stages — glycolysis, pyruvate oxidation, the citric acid cycle and oxidative phosphorylation — with the net energy yield at each step and the validated assay kits to measure it in your own samples.
Browse Metabolism Assay Kits →Quick answer
Cellular respiration is the process cells use to convert glucose and oxygen into ATP, carbon dioxide and water. It happens in four stages — glycolysis, pyruvate oxidation, the citric acid cycle and oxidative phosphorylation — producing a net 30–32 ATP per glucose in eukaryotic cells.
Assay kits for cellular respiration research
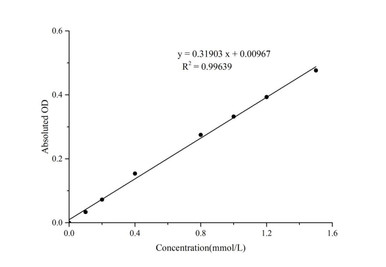
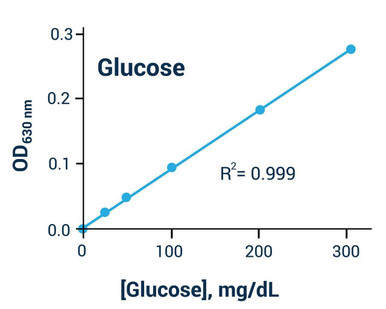
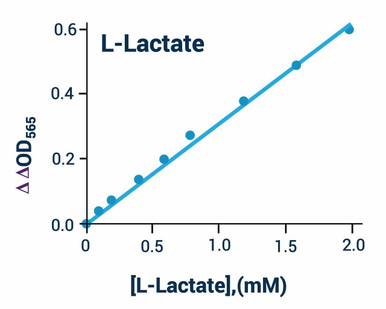
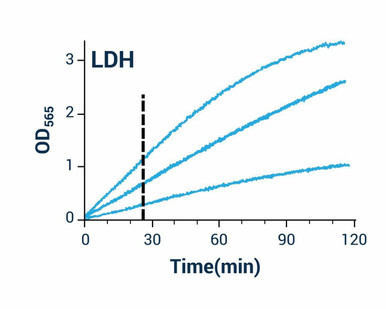
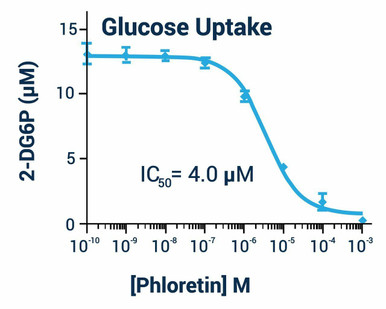
Measuring cellular respiration in a real lab almost always means quantifying one of three things: ATP itself, a pathway enzyme, or a substrate/product. Assay Genie supplies validated kits for each — including ATP, glucose, glucose uptake, lactate, LDH and fatty acid oxidation assays.
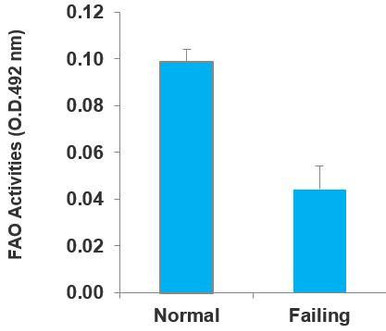
Fatty Acid Oxidation Assay Kit
Quantify beta-oxidation flux feeding acetyl-CoA into respiration.
View kit- What is cellular respiration?
- The cellular respiration equation
- Aerobic vs anaerobic respiration
- The four stages (with ATP yield)
- Stage 1: Glycolysis
- Stage 2: Pyruvate oxidation
- Stage 3: Citric acid cycle
- Stage 4: Oxidative phosphorylation
- Net ATP calculation
- Anaerobic respiration & fermentation
- Regulation of cellular respiration
- The Warburg effect & mitochondrial dysfunction
- How to study cellular respiration in the lab
- Frequently asked questions
What is cellular respiration?
Cellular respiration is a fundamental biological process in which cells convert nutrient molecules — primarily glucose — into adenosine triphosphate (ATP), the universal energy currency of the cell. The process occurs in the mitochondria of eukaryotic cells and in the cytoplasm of prokaryotic cells.
The energy released drives essential cellular activities: muscle contraction, active transport, macromolecule synthesis, and the maintenance of ion gradients. Roughly 90% of the ATP a typical human cell uses every day is produced by cellular respiration in the mitochondria.
The cellular respiration equation
The overall balanced equation for aerobic cellular respiration is:
C6H12O6 + 6 O2 → 6 CO2 + 6 H2O + ~30–32 ATPOne molecule of glucose plus six molecules of oxygen is converted into six molecules of carbon dioxide, six molecules of water, and energy in the form of ATP. The actual ATP yield depends on the shuttle system used to move cytoplasmic NADH into the mitochondria and on the precise P/O ratio of the electron transport chain.
Aerobic vs anaerobic respiration
Cellular respiration takes two forms depending on whether oxygen is present. The two pathways share glycolysis but diverge afterwards:
| Feature | Aerobic respiration | Anaerobic respiration |
|---|---|---|
| Oxygen required? | Yes | No |
| Location | Cytoplasm + mitochondria | Cytoplasm only |
| Final electron acceptor | Oxygen (O2) | Pyruvate (animals) or acetaldehyde (yeast); nitrate/sulfate in bacteria |
| End products | CO2, H2O, ATP | Lactate (animals) or ethanol + CO2 (yeast) |
| Net ATP per glucose | 30–32 | 2 |
| Typical cells | Most human cells under normal O2 | Skeletal muscle during exercise; yeast; many bacteria; cancer cells (Warburg effect) |
The four stages of aerobic cellular respiration
Aerobic cellular respiration is split into four sequential stages. Each stage has its own location, substrate, products, and contribution to overall ATP yield:
| Stage | Location | Substrate → Product | Direct ATP | NADH / FADH2 |
|---|---|---|---|---|
| 1. Glycolysis | Cytoplasm | Glucose → 2 Pyruvate | +2 net | 2 NADH |
| 2. Pyruvate oxidation | Mitochondrial matrix | 2 Pyruvate → 2 Acetyl-CoA | 0 | 2 NADH |
| 3. Citric acid cycle | Mitochondrial matrix | 2 Acetyl-CoA → 4 CO2 | +2 (GTP/ATP) | 6 NADH, 2 FADH2 |
| 4. Oxidative phosphorylation | Inner mitochondrial membrane | NADH + FADH2 + O2 → H2O | +26 to +28 | (consumed) |
Textbook note: Older textbooks cite 36–38 ATP per glucose. Updated P/O ratios — 2.5 ATP per NADH, 1.5 ATP per FADH2 — give the more realistic 30–32 ATP figure used here.
Stage 1: Glycolysis
Glycolysis is the cytoplasmic breakdown of one molecule of glucose (6 carbons) into two molecules of pyruvate (3 carbons each). It is the oldest and most universal energy-yielding pathway in biology and occurs whether oxygen is present or not.
Investment phase (steps 1–5)
The cell spends 2 ATP to prime the glucose molecule for breakdown. Hexokinase phosphorylates glucose to glucose-6-phosphate, which is isomerised to fructose-6-phosphate by phosphoglucose isomerase, and then phosphorylated again by phosphofructokinase-1 (PFK-1) — the rate-limiting and most regulated enzyme of glycolysis. The resulting fructose-1,6-bisphosphate is cleaved by aldolase into two triose phosphates, which are interconverted by triose phosphate isomerase.
Payoff phase (steps 6–10)
Each triose phosphate is oxidised by GAPDH with reduction of NAD+ to NADH, then dephosphorylated through reactions catalysed by phosphoglycerate kinase, phosphoglycerate mutase, enolase, and finally pyruvate kinase to yield pyruvate. Substrate-level phosphorylation produces 4 ATP across both triose molecules — a net gain of 2 ATP after the initial investment.
Net per glucose: 2 pyruvate, 2 NADH, 2 ATP.
Deep dive: For a full enzyme-by-enzyme walkthrough with diagram and regulation, see our companion guide: The 10 Steps of Glycolysis: Enzymes, Diagram & ATP Yield.
Stage 2: Pyruvate oxidation (the link reaction)
Pyruvate must travel from the cytoplasm into the mitochondrial matrix, where it is converted into acetyl-CoA by the pyruvate dehydrogenase complex (PDC) — a three-enzyme assembly comprising pyruvate dehydrogenase (E1), dihydrolipoamide transacetylase (E2), and dihydrolipoamide dehydrogenase (E3). One CO2 is released and one NADH is generated for each pyruvate.
PDC is heavily regulated: it is inhibited by its own products (acetyl-CoA, NADH, ATP) and activated when ADP and pyruvate are high. Defects in PDC cause severe lactic acidosis and neurodegenerative disease, and PDC activity is now studied as a potential metabolic target in cancer.
Net per glucose (both pyruvates): 2 Acetyl-CoA, 2 NADH, 2 CO2.
Stage 3: The citric acid cycle (Krebs cycle / TCA cycle)
Acetyl-CoA enters the citric acid cycle by combining with oxaloacetate to form citrate. Each turn of the cycle releases two molecules of CO2 and harvests high-energy electrons as NADH and FADH2. Because each glucose molecule yields two acetyl-CoA, the cycle turns twice per glucose.
Acetyl-CoA combines with oxaloacetate to form citrate via citrate synthase; aconitase rearranges citrate to isocitrate; isocitrate dehydrogenase and the α-ketoglutarate dehydrogenase complex each generate NADH and release CO2; succinate dehydrogenase generates FADH2; fumarase hydrates fumarate to malate; and malate dehydrogenase regenerates oxaloacetate to start the next turn.
Per cycle turn (per acetyl-CoA)
- 3 NADH (from isocitrate, α-ketoglutarate and malate)
- 1 FADH2 (from succinate)
- 1 GTP/ATP (substrate-level phosphorylation at succinyl-CoA)
- 2 CO2 released
Net per glucose (both turns): 6 NADH, 2 FADH2, 2 ATP, 4 CO2.
Stage 4: Oxidative phosphorylation
Oxidative phosphorylation captures the energy stored in NADH and FADH2 as ATP. It has two coupled parts:
The electron transport chain (ETC)
Four protein complexes embedded in the inner mitochondrial membrane (Complexes I–IV) pass electrons from NADH and FADH2 down a chain of redox carriers to oxygen, the final electron acceptor. As the electrons descend, Complexes I, III and IV pump protons (H+) from the matrix into the intermembrane space, creating an electrochemical gradient — the proton-motive force.
Chemiosmosis & ATP synthase
Protons flow back into the matrix down their gradient through ATP synthase, a rotary motor enzyme that uses the energy of proton flux to phosphorylate ADP into ATP. At the end of the chain, four electrons combine with one O2 and four H+ to form two H2O.
Net per glucose: ~26–28 ATP (using P/O ratios of 2.5 for NADH and 1.5 for FADH2).
Net ATP calculation per glucose
| Source | Quantity | ATP yield (each) | ATP subtotal |
|---|---|---|---|
| Glycolysis (substrate-level) | — | — | +2 |
| Glycolysis NADH (via shuttle) | 2 | 1.5–2.5 | +3 to +5 |
| Pyruvate oxidation NADH | 2 | 2.5 | +5 |
| Citric acid cycle substrate-level | 2 | 1 | +2 |
| Citric acid cycle NADH | 6 | 2.5 | +15 |
| Citric acid cycle FADH2 | 2 | 1.5 | +3 |
| Total | ~30–32 ATP |
Anaerobic respiration & fermentation
When oxygen is unavailable, the electron transport chain stalls, NADH cannot be reoxidised, and the citric acid cycle grinds to a halt. Cells then rely on glycolysis alone, regenerating NAD+ by fermenting pyruvate.
Lactate fermentation
In skeletal muscle during intense exercise and in many bacteria, lactate dehydrogenase reduces pyruvate to lactate, regenerating NAD+ so glycolysis can continue. Lactate is later cleared by the liver via the Cori cycle.
Ethanol fermentation
Yeast and some bacteria decarboxylate pyruvate to acetaldehyde, which is then reduced to ethanol, regenerating NAD+. This pathway powers the brewing and bread-making industries.
Alternative electron acceptors in bacteria
Some prokaryotes use nitrate (NO3-), sulfate (SO42-), or sulfur as final electron acceptors instead of oxygen, producing nitrogen gas or hydrogen sulfide as byproducts. These pathways underpin biogeochemical cycling in soils and sediments.
Regulation of cellular respiration
Respiration is tuned at multiple checkpoints to match ATP supply with cellular demand:
- PFK-1 in glycolysis is inhibited by high ATP and citrate, activated by AMP and fructose-2,6-bisphosphate.
- Pyruvate dehydrogenase is inhibited by its products (acetyl-CoA, NADH, ATP) and by phosphorylation.
- The citric acid cycle is throttled by NADH/NAD+ ratio and by ATP levels.
- Oxidative phosphorylation is limited by ADP availability and oxygen tension.
- Hormonal control via insulin and glucagon regulates substrate supply, while transcription factors like HIF-1α and PGC-1α reshape metabolic capacity over hours to days.
The Warburg effect & mitochondrial dysfunction
Otto Warburg observed in the 1920s that tumour cells preferentially perform glycolysis followed by lactate fermentation — even when oxygen is plentiful. This shift, the Warburg effect, is now considered a metabolic hallmark of cancer and underpins clinical FDG-PET imaging.
Mitochondrial dysfunction is also implicated in inherited mitochondrial disorders (MELAS, MERRF, Leigh syndrome, Kearns–Sayre), neurodegenerative disease (Alzheimer's, Parkinson's), insulin resistance, and ageing. These conditions are now active drug targets — many of which require precise quantification of metabolic flux to study.
Studying cellular metabolism?
From glucose uptake to ATP, lactate and fatty acid oxidation, Assay Genie's metabolism assay kits give you validated, publication-ready data — with expert technical support from our PhD team.
Explore Metabolism Assay Kits →Frequently asked questions
What is cellular respiration in simple terms?
Cellular respiration is the process cells use to convert glucose and oxygen into ATP (cellular energy), carbon dioxide and water. It happens in four stages — glycolysis, pyruvate oxidation, the citric acid cycle and oxidative phosphorylation — and produces 30–32 ATP per glucose molecule in eukaryotic cells.
What are the four stages of cellular respiration?
The four stages of aerobic cellular respiration are: (1) glycolysis in the cytoplasm, (2) pyruvate oxidation in the mitochondrial matrix, (3) the citric acid cycle (Krebs / TCA cycle) in the mitochondrial matrix, and (4) oxidative phosphorylation on the inner mitochondrial membrane.
How much ATP is produced in cellular respiration?
Aerobic cellular respiration produces a net 30–32 ATP per glucose molecule: 2 ATP from glycolysis, 2 ATP from the citric acid cycle, and 26–28 ATP from oxidative phosphorylation. Older textbooks cite 36–38 ATP, but updated P/O ratios place the realistic yield at 30–32.
What is the equation for cellular respiration?
C6H12O6 + 6 O2 → 6 CO2 + 6 H2O + ~30–32 ATP. One molecule of glucose plus six molecules of oxygen produce six molecules of carbon dioxide, six molecules of water, and ATP.
Where does cellular respiration take place?
In eukaryotic cells, glycolysis occurs in the cytoplasm and the remaining three stages take place in the mitochondria. In prokaryotic cells, all stages occur in the cytoplasm and across the plasma membrane.
What is the difference between aerobic and anaerobic respiration?
Aerobic respiration requires oxygen, occurs in mitochondria, fully oxidises glucose to CO2 and water, and produces 30–32 ATP per glucose. Anaerobic respiration occurs without oxygen, takes place in the cytoplasm, produces only 2 ATP per glucose, and yields lactate or ethanol instead of CO2 and water.
What is the role of oxygen in cellular respiration?
Oxygen is the final electron acceptor in the electron transport chain. Without oxygen, the chain backs up, NADH cannot be reoxidised, and the citric acid cycle stalls — forcing cells to switch to anaerobic glycolysis with much lower ATP yield.
What is the Warburg effect?
The Warburg effect is the observation that cancer cells preferentially use glycolysis followed by lactate fermentation for ATP production — even when oxygen is plentiful. First described by Otto Warburg in the 1920s, it is now considered a metabolic hallmark of cancer.
How does NADH contribute to ATP production?
Each NADH donates two high-energy electrons to Complex I of the electron transport chain. These electrons drive proton pumping across the inner mitochondrial membrane, creating the proton-motive force that ATP synthase uses to make ATP. Each NADH yields ~2.5 ATP; each FADH2 yields ~1.5 ATP.
What is the role of the mitochondria in cellular respiration?
Mitochondria house pyruvate oxidation, the citric acid cycle and oxidative phosphorylation. The inner mitochondrial membrane carries the electron transport chain and ATP synthase, and the matrix contains the citric acid cycle enzymes. Together, mitochondria produce roughly 90% of a eukaryotic cell's ATP.
What products are formed in cellular respiration?
The end products of aerobic cellular respiration are carbon dioxide (CO2), water (H2O) and ATP. Heat is also released. Anaerobic respiration produces lactate in animal cells or ethanol plus CO2 in yeast.
What is chemiosmosis?
Chemiosmosis is the movement of protons (H+) down their electrochemical gradient across the inner mitochondrial membrane through ATP synthase. The energy released by this proton flow drives ATP synthase to phosphorylate ADP, generating most of the cell's ATP.
How is cellular respiration regulated?
Respiration is controlled at multiple checkpoints by feedback inhibition (ATP and citrate inhibit PFK-1; NADH inhibits the citric acid cycle), substrate availability, hormonal signals (insulin and glucagon), redox state, and transcriptional control of metabolic enzymes.
What is the difference between cellular respiration and photosynthesis?
Photosynthesis stores solar energy in glucose using CO2 and water, releasing oxygen. Cellular respiration releases that stored energy by breaking glucose down to CO2 and water using oxygen. The two processes form a complementary cycle that supports nearly all life on Earth.
Can you measure cellular respiration in the lab?
Yes — cellular respiration is routinely measured using extracellular flux analysis (oxygen consumption rate and extracellular acidification rate), ATP-based assay kits, glucose uptake assays, and ELISA kits for individual pathway enzymes such as pyruvate dehydrogenase and hexokinase-1.
Related articles
Recent Posts
-
ELISA vs Western Blot: Which Technique Should You Choose?
Written by Seán Mac Fhearraigh, PhD • Updated: 19 May 2026 • ~9 min read Quick Answer ELISA …20th May 2026 -
Types of ELISA: Direct, Indirect, Sandwich & Competitive Compared
Written by Seán Mac Fhearraigh, PhD • Updated: 19 May 2026 • ~9 min read Quick Answer The fi …20th May 2026 -
Sandwich ELISA: Step-by-Step Protocol & Troubleshooting
Written by Seán Mac Fhearraigh, PhD • Updated: 19 May 2026 • ~ …20th May 2026